Resources
Keynesian Model of Economic Fluctuations
Contrary to the previous chapters where quantities or prices were assumed flexible, the short-run framework of the Keynesian model assumes that output prices and wages are fixed. In this general equilibrium, output and the interest rate are simultaneously determined through the interaction of the goods market and the financial market. Consequently, fluctuations in output and employment are driven by shifts in the demand for goods and changes in the money supply.
In this model, we’re assuming a closed economy without international trade.
Three equilibria are considered:
- Goods Market Equilibrium (IS Curve): Represents combinations of output and interest rate where the goods market is in equilibrium.
- Money Market Equilibrium (LM Curve): Represents combinations of output and interest rate where the money market is in equilibrium.
- General Equilibrium (IS-LM Model): The intersection of the IS and LM curves determines the general equilibrium in both markets.
General Equilibrium
The general equilibrium in the IS-LM model is found at the intersection of the IS and LM curves, where both the goods market and the money market are in equilibrium simultaneously. This point determines the equilibrium levels of output and interest rate in the economy.
To find the general equilibrium, we equalize the output conditions for both market curves IS and LM:
Fiscal Policy
Fiscal policy involves changes in government spending and taxes to influence economic activity. In the IS-LM model:
- Expansionary Fiscal Policy, such as increasing government spending or decreasing taxes, leads to an increase in output and interest rate , shifting the IS curve to the right.
- Contractionary Fiscal Policy is the opposite: actions like decreasing government spending or increasing taxes, leads to a decrease in output and interest rate , shifting the IS curve to the left.
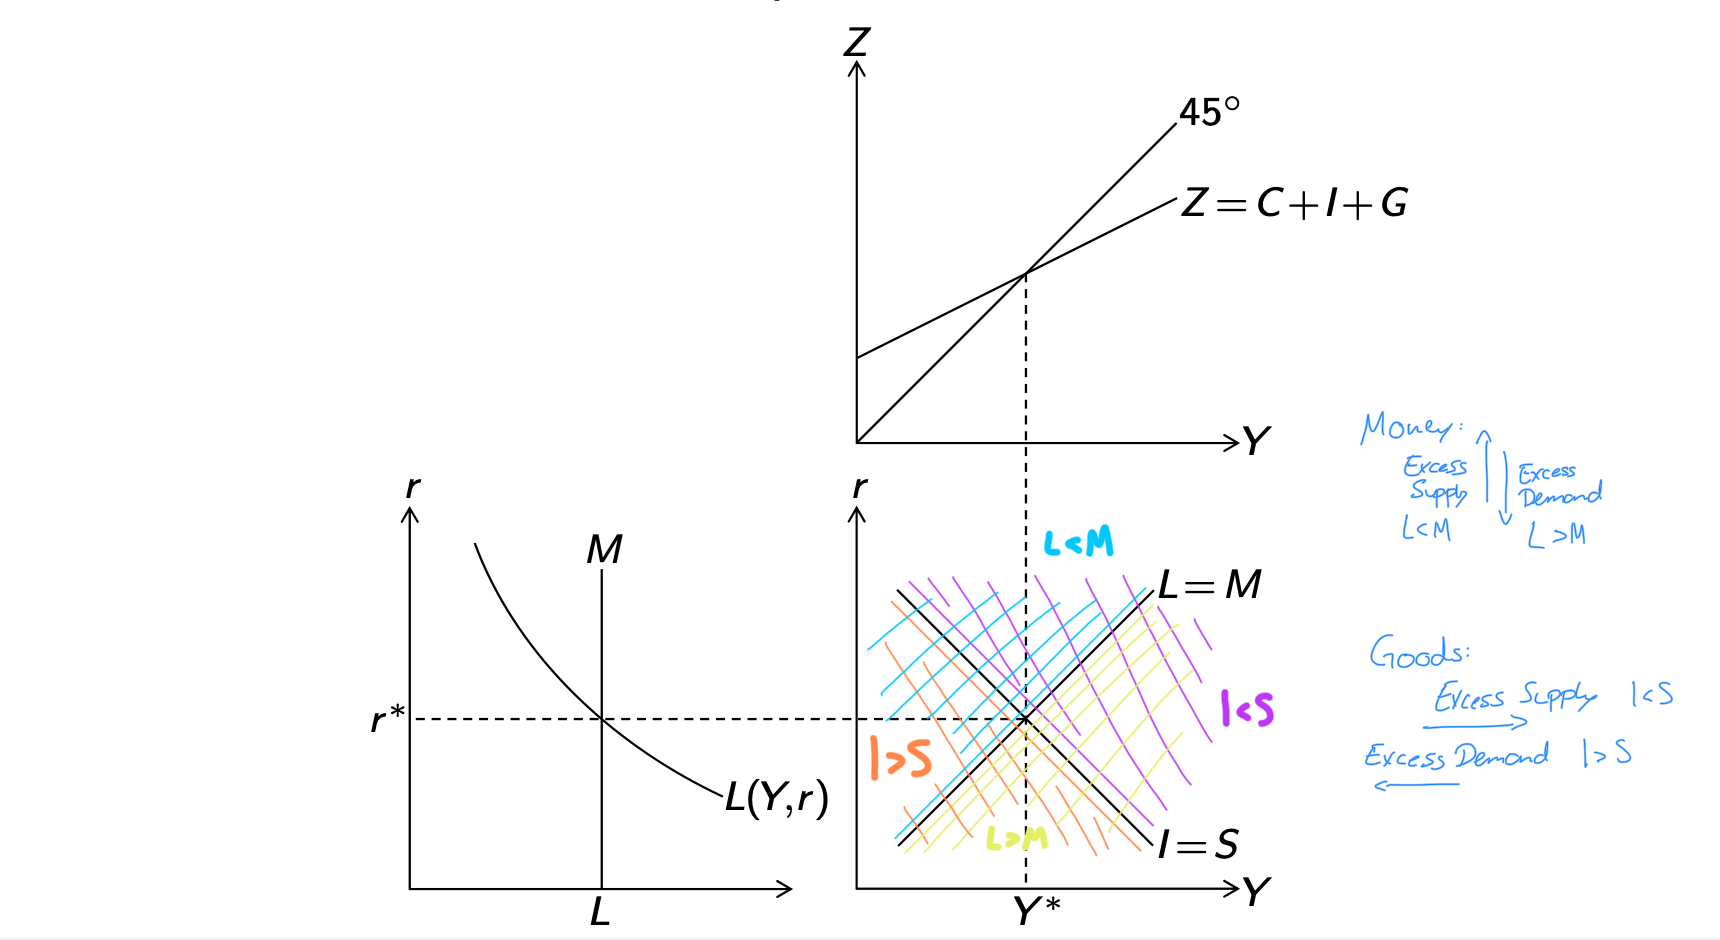
Points right of the IS curve indicate excess demand in the goods market, while points left indicate excess supply.
Monetary Policy
Monetary policy involves changes in the money supply to influence economic activity. In the IS-LM model:
- Expansionary Monetary Policy, such as increasing the money supply, leads to a decrease in interest rate and an increase in output , shifting the LM curve down/right.
- Contractionary Monetary Policy is the opposite: actions like decreasing the money supply, leads to an increase in interest rate and a decrease in output , shifting the LM curve up/left.
Points above the LM curve indicate excess supply in the money market, while points below indicate excess demand.
| Expansionary Policies | Output Y∗ | Interest Rate r∗ | Consumption C∗ | Private Savings | Investment I∗ | Total Savings S∗ |
|---|---|---|---|---|---|---|
| : More Gov. Spending | (crowding out) | |||||
| : Less Taxes | ||||||
| : Higher Money Supply |
- Higher government spending causes crowding out: Higher raises , which reduces private investment, dampening the total gain.
- Higher money supply causes investment stimulus: Lower makes borrowing cheaper, fueling investment and overall income.
todo table: differentiate between private and total savings?
Goods Market: IS Curve
In the goods market, output is determined by the demand for goods . The goods market is in equilibrium when output equals demand (). Alternatively, this can be expressed as planned investment equaling savings ().
Goods Market Equilibrium
The goods market is in equilibrium when output equals demand, equivalently, when savings equal planned investment, or when total planned expenditures equal total output:
With , this is the point where the demand line intersects with the 45-degree line in the Keynesian cross diagram.
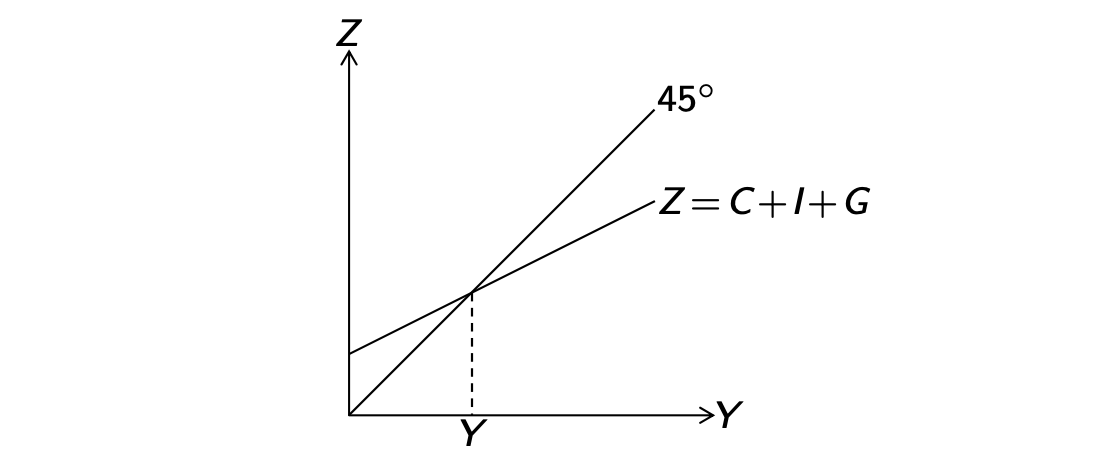
If demand falls short of output (or planned investment is less than savings), firms will reduce production, leading to a decrease in output , and vice versa when inventories are depleted to meet increased demand. This adjustment continues until the goods market reaches equilibrium at .
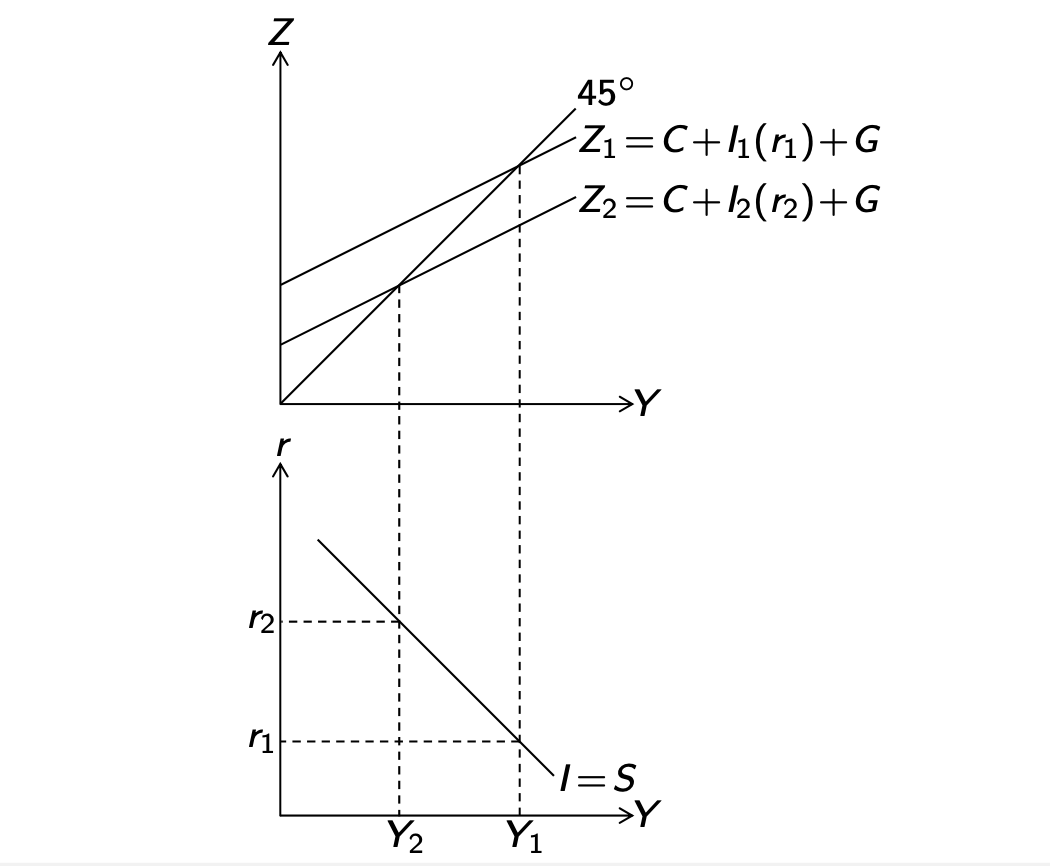
IS Curve
The IS curve shows all combinations of output and interest rate where the goods market is in equilibrium (). It is downward sloping because higher interest rates lead to lower planned investment (), reducing overall demand and output.
Multiplier Effect
The multiplier effect describes how a change in an exogenous component of demand (like government spending or taxes ) leads to a more than proportional change in output .
The multiplier is the partial derivative of output with respect to an exogenous demand component. For government spending, the multiplier is positive:
For taxes, the multiplier is negative:
This implies that an increase in government spending increases output more than the initial spending, while an increase in taxes decreases output.
Demand
Demand of the goods market are planned expenditures , consisting of private consumption , planned investment , and government spending :
where is the output/income, are taxes, and is the interest rate.
The first part of the equation is private consumption as a function of disposable income and taxes . T is exogenous (fixed by government), and we assume that the marginal propensity to consume () is constant. is the partial derivative of consumption with respect to disposable income:
The second part is planned investment, which depends negatively on the interest rate and decreases with higher . Lastly, government spending is exogenous (not influenced by the model).
Taxes and government spending are defined to be positive.
Savings
Total savings are made up of private savings and public savings :
Private Savings are the disposable income minus private consumption:
Public Savings, sometimes called Primary Surplus, are the difference between taxes and government spending:
Total Savings:
Financial Market: LM Curve
In financial markets, the amount of money supplied is exogenous. The demand for money depends on the interest rate and the level of income/output . The money market is in equilibrium when money supply equals money demand.
Financial Market Equilibrium
The money market is in equilibrium when money supply equals money demand:
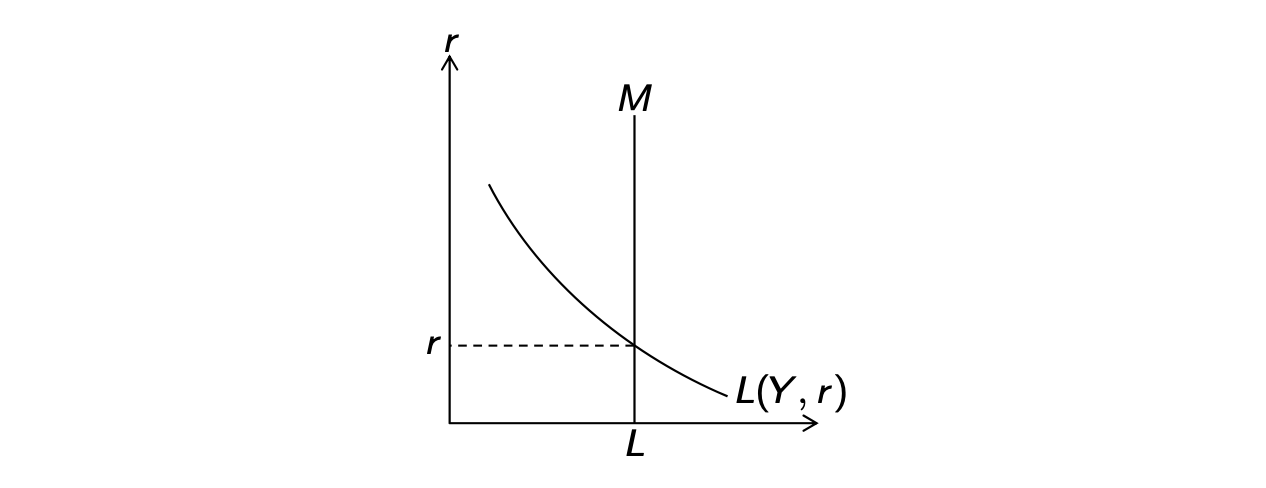
If money supply exceeds money demand, individuals will try to convert excess money into interest-bearing assets, leading to a decrease in the interest rate . Conversely, if money demand exceeds supply, individuals will sell interest-bearing assets to obtain more money, causing the interest rate to rise. This adjustment continues until the money market reaches equilibrium at .
LM Curve
The LM curve shows all combinations of output and interest rate where the money market is in equilibrium (). It is upward sloping because higher output increases the demand for money (), leading to higher interest rates for a given money supply.
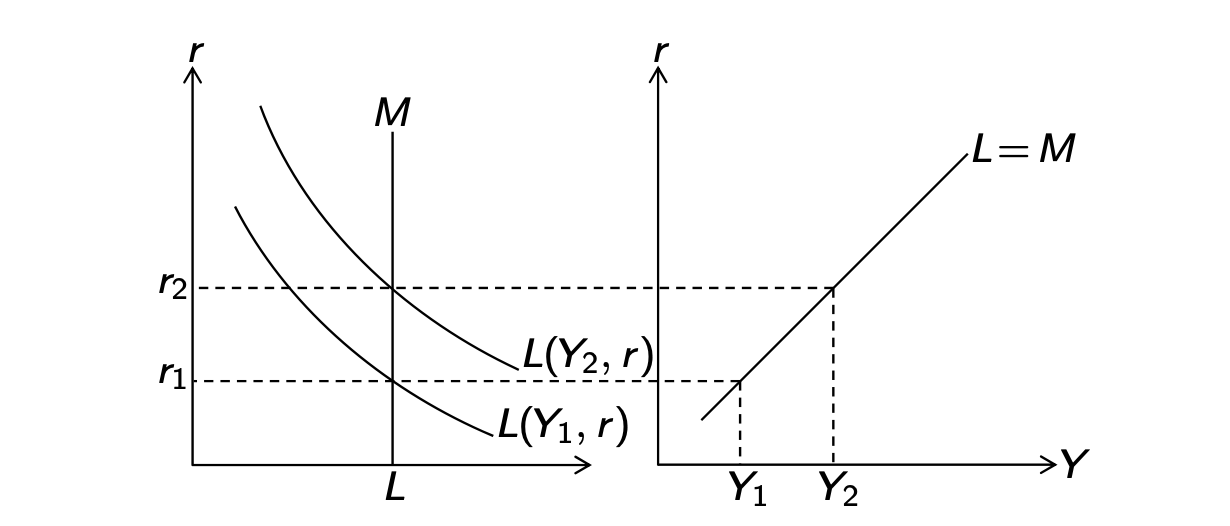
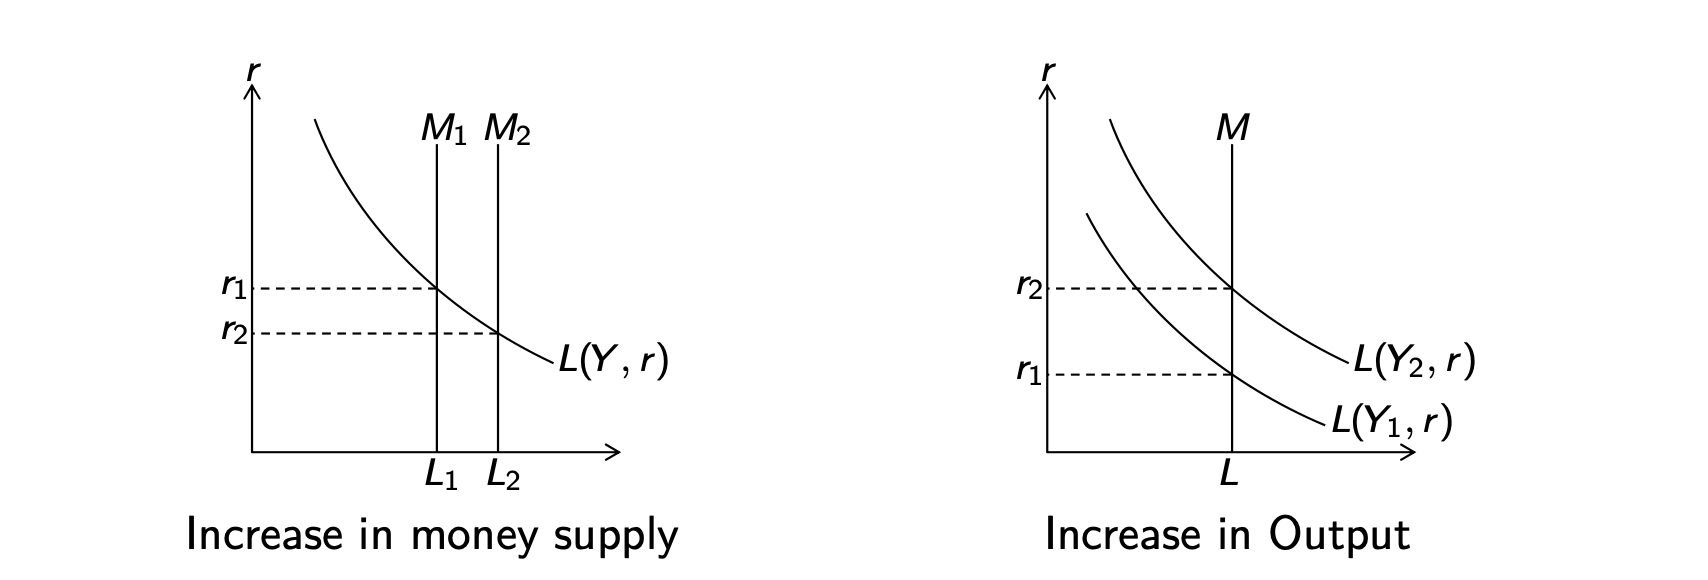
Changes in Money Supply and Output
- An increase in the money supply causes a decline in interest rates for a given level of output, shifting the LM curve down/right, and vice versa.
- An increase in output raises the demand for money, leading to higher interest rates for a given money supply, shifting the LM curve up/left, and vice versa.
Demand for Liquidity
Demand for money (liquidity) depends positively on output and negatively on the interest rate :
Higher output increases the demand for money as more transactions occur, while higher interest rates decrease the demand for money since holding money becomes more costly compared to interest-bearing assets.
The supply of money is exogenous and controlled by the central bank.
Example Problem
These are the market macroeconomic indicators problem from exercise exam 1 with some questions from exercise 8 and exercise exam 2.
Private consumption is given by:
Planned investment is given by:
Liquidity demand is given by:
with Taxes , Government consumption , and Money supply .
Preparation
Derive IS curve for Y:
Derive LM curve for Y:
Questions
In general equilibrium, what is ?
Set IS = LM and solve for :
What is the government consumption multiplier?
Take the partial derivative of the IS curve with respect to :
Assume and . If output is , what is the money supply ?
Determine from curve:
Use in curve to find :
If government consumption and taxes are decreased by 100 each, and money supply is increased by 100, how do private savings in general equilibrium change?
First, determine the change on using the partial derivatives of the equilibrium interest rate equation:
Taking partial derivatives:
Then determine the change in output using partial differentials on the curve ():
Finally, determine the change in private savings :
How does an increase in government consumption, taxes, or money supply lead to an increase or decrease in private savings in general equilibrium?
- An increase in government consumption leads to a decrease in private savings because it raises output and interest rates , which increases consumption.
- An increase in taxes leads to a decrease in private savings because it reduces disposable income, leading to lower consumption and output .
- An increase in money supply leads to an increase in private savings because it lowers interest rates , stimulating investment and output , which increases income and savings.
Approaches
Goods Market (IS Curve)
- Derive the IS Equation: Set . Solve for to get output as a function of and .
- The Multiplier:
- Government Spending Multiplier: .
- Tax Multiplier: .
- Shift Factors: Changes in or shift the IS curve. Increase in or decrease in shifts it right (Expansionary).
Money Market (LM Curve)
- Derive the LM Equation: Set Money Demand equal to Money Supply . Solve for (or ) to see the relationship between output and interest rates.
- Shift Factors: Changes in Money Supply shift the LM curve. An increase in shifts the LM curve down/right (Expansionary).
General Equilibrium (IS-LM)
- Solve for Equilibrium: Set the IS equation equal to the LM equation () to find the equilibrium interest rate . Substitute back into either equation to find .
- Policy Analysis (Partial Derivatives): To find how a variable (like or ) changes with respect to a policy change, take the partial derivative of the equilibrium expression for that variable (e.g., ).
Savings & Investment
- Private Savings: .
- Public Savings (Budget Balance): .
- Identity Check: In equilibrium, total savings must equal investment .