Resources
- Slides
- Exercise Slides
- Recording Lecture, Exercise
Replicability Crisis
Despite the scientific method and statistical tools, many research findings have been found to be non-replicable. In psychology, Brian Nosek found a replicability of only 36%, and even in experimental economics only 61% of studies could be replicated successfully. This has led to a “replicability crisis” in various scientific fields.
A significant factor to ensure replicability is to set up studies in a transparent and reproducible manner, which is the focus of Open Science. This includes coming up with a hypothesis and registering it before data collection, sharing data and code, and publishing in open access formats.
Questionable Research Practices
When researchers deviate from the ideal scientific method, it can lead to questionable research practices that inflate false positive rates. Two common practices are:
HARKing
Hypothesizing After the Results are Known. This practice can lead to false positives and is discouraged in scientific research. If collected data changes the hypothesis, a new study should be conducted to test the new hypothesis.
p-hacking
Manipulating data analysis until statistically significant results are obtained. This can involve trying multiple analyses and only reporting those that yield significant results, or collecting more data until significance is reached. It may also involve selective reporting of studies or rounding p-values to appear significant.
Degrees of Freedom in Data Collection
Researchers have many degrees of freedom in how they collect and analyze data, which can lead to biased results. Examples include:
- Deciding when to stop data collection based on interim results
- Defining and exluding outliers post hoc
- Choosing covariates and moderators after seeing the data
- Reported measures and conditions based on what yields significant results
- Data transformations and statistical models chosen after looking at the data
Ideally, all these decisions should be decided a priori and pre-registered to avoid bias.
Result-contingent decisions can increase the false positive rate significantly. For a study comparing two groups on 20 observations, the false positive rate can rise from 5% to:
| Degree of Freedom | False Positive Rate |
|---|---|
| A: Adding an independent variable | 9.5% |
| B: Adding 10 more observations per condition, if original sample size is non-significant | 7.7% |
| C: Controlling for a third binary variable, e.g. gender | 11.7% |
| D: Including an additional condition and dropping one if it yields non-significant results | 12.6% |
| A + B | 14.4% |
| A + B + C | 30.9% |
| A + B + C + D | 60.7% |
Preregistration
To solve the issue of questionable post-hoc decisions, researchers can preregister their studies. Preregistration helps to distinguish between confirmatory and exploratory analyses and reduces the risk of biased results. Once submitted to a platform like AsPredicted or OSF, the plan is timestamped and cannot be changed. Such a plan includes:
- Research question and hypotheses
- Dependent and independent variables and how they connect to the hypotheses
- Study design, including sample size (based on power analysis) and data collection methods
- Statistical models to adress the hypotheses, including transformations
- Criteria for data exclusion and handling of outliers
If there are deviations from the preregistered plan, they should be transparently reported in the publication. Additional analyses can be conducted but should be labeled as exploratory.
Open Data
To allow for verification and replication, researchers should share their data and code on platforms like OSF. This may include materials used for data collection, preregistration files, collected data and analysis code. Once submitted, everyone should be able to access and reproduce the results.
Open data also allows other researchers to conduct meta-analyses and build upon existing work.
Bayesian Analysis
Traditional null hypothesis significance testing (NHST) has limitations, such as the arbitrary p-value threshold and the inability to provide evidence for the null hypothesis. When and are equally likely, under a p-value of , is correct in 94% of cases. However, if is only true in 10% of cases, the probability that is correct given a p-value of drops to 64%.
To better understand the evidence provided by data, or the trustworthiness of results, Bayesian statistics can be used. Bayesian analysis allows for the incorporation of prior beliefs and provides a more intuitive interpretation of results.
Instead of calculating the probability of the data given the null hypothesis (-value), Bayesian analysis calculates the probability of the hypothesis given the data.
Posterior = (Likelihood × Prior) / Evidence
Here, the prior represents our belief about the hypothesis before seeing the data, and the posterior represents our bayed belief after considering the data.
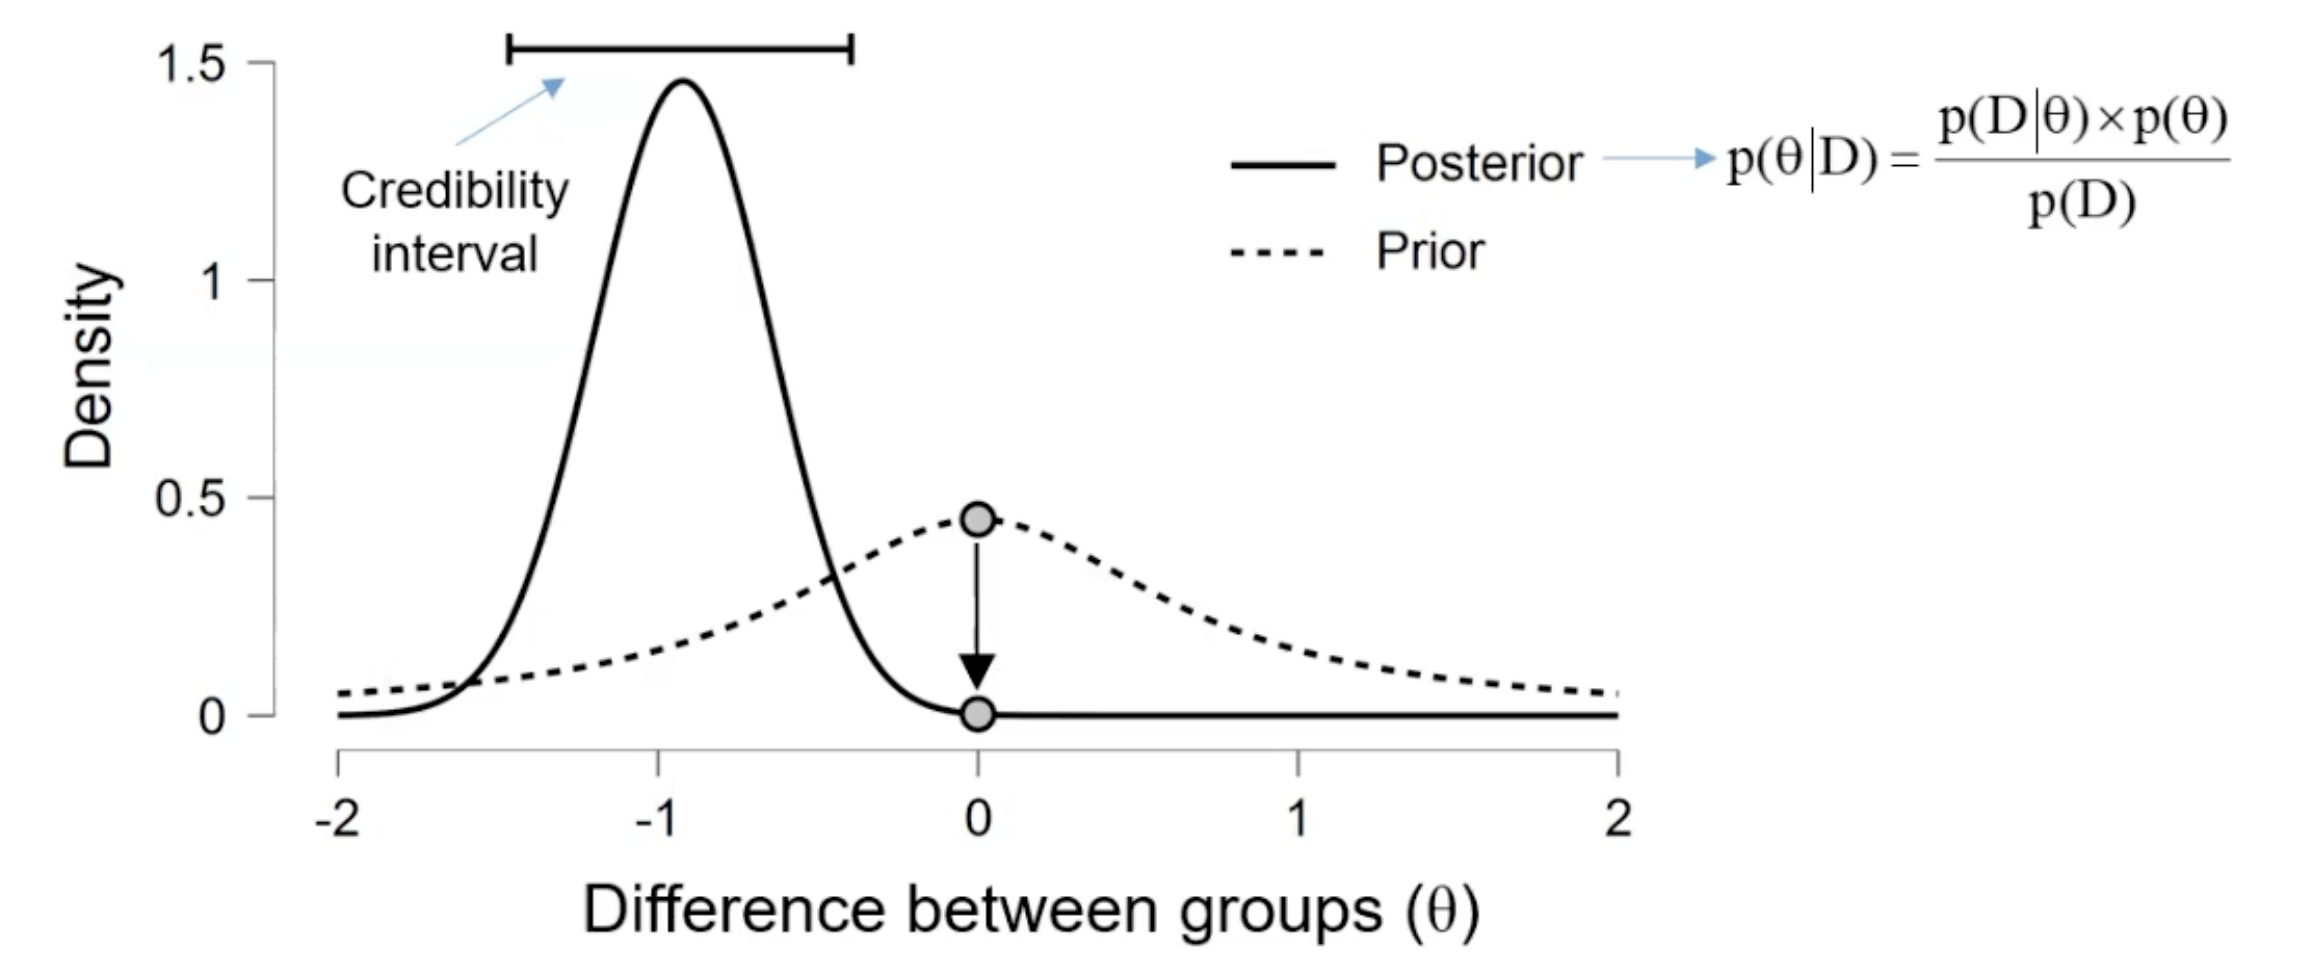
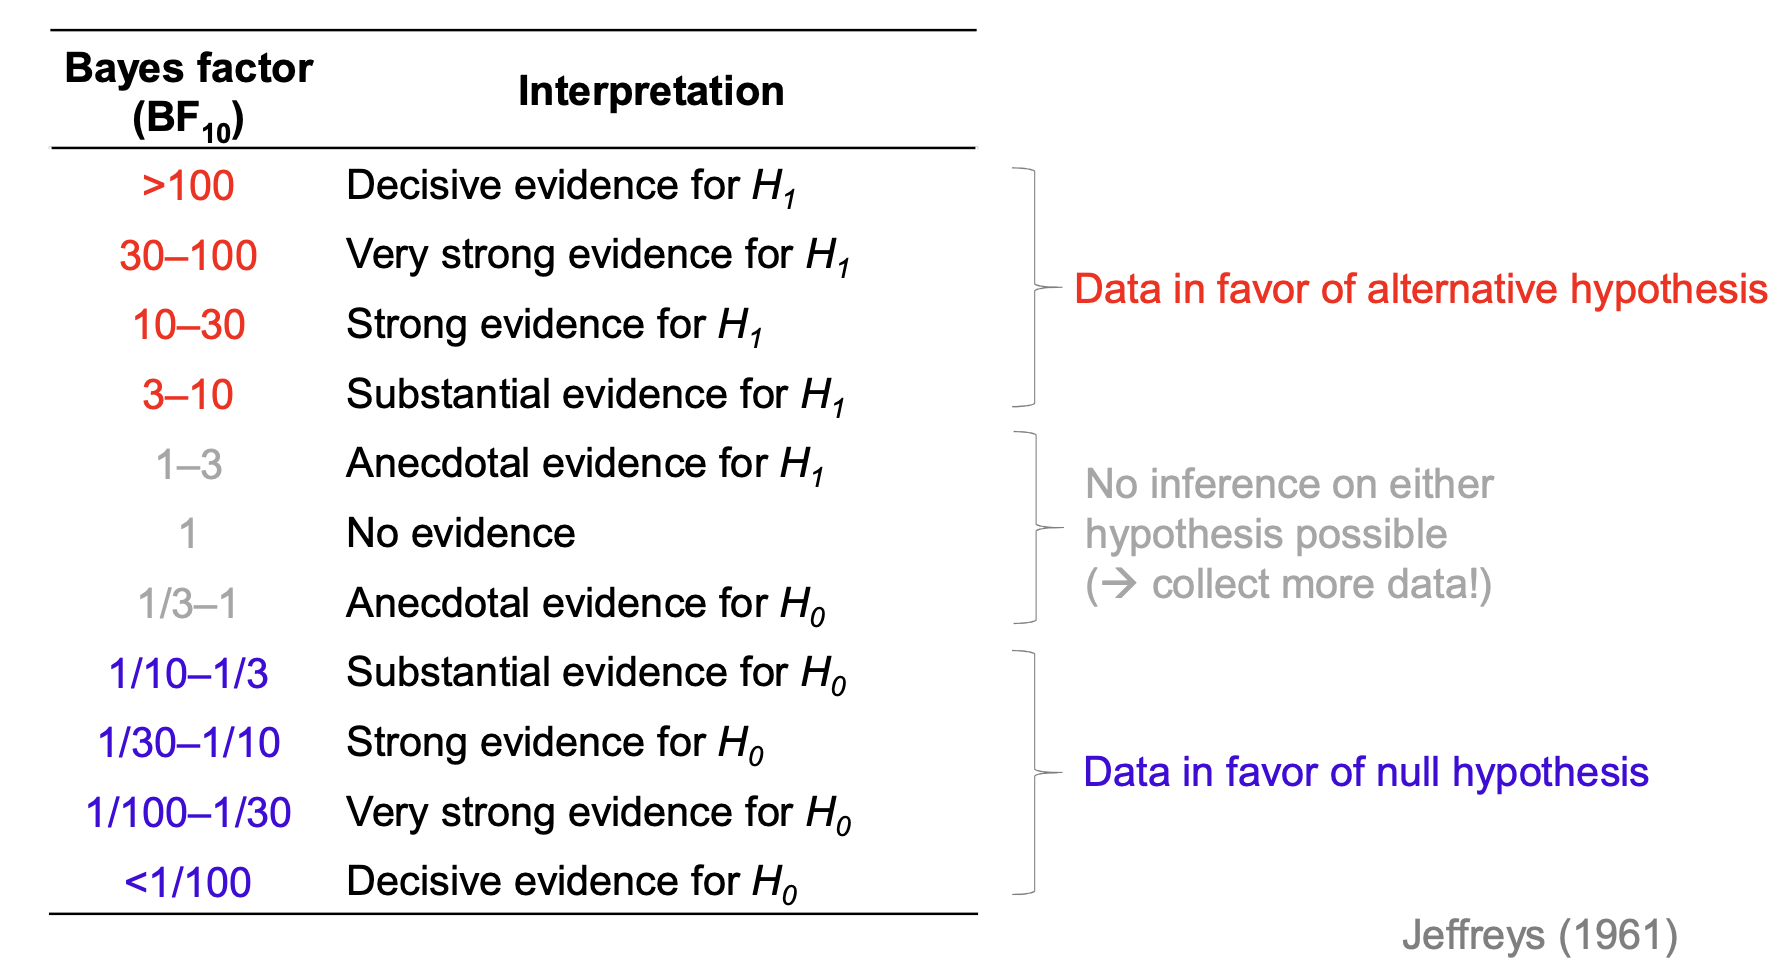
Bayes Factor
The Bayes Factor (BF) quantifies the evidence provided by the data in favor of one hypothesis over another. It is calculated as:
It is a likelihood ratio of the data under two competing hypotheses, or the difference of the density for the reference value under the posterior and prior distribution. Contrary to p-values, Bayes Factors can provide evidence for both and .
Bayesian t-tests are more consistent than traditional t-tests, especially with small sample sizes.