Resources
Fundamental Concepts
Scarcity
Human wants typically exceed the resources available to satisfy them, forcing trade-offs. (p. 5)
Opportunity Cost: The value of the next best alternative that is forgone when making a choice.
Optimization
Rational individuals aim to:
- Maximize utility (satisfaction) from a given set of resources.
- Minimize resource use to obtain a given level of utility.
Equilibrium
A situation where the choices of all agents are mutually compatible and individually optimal, meaning no single agent has an incentive to change their behavior. (p. 6)
Efficiency
An allocation of resources is Pareto efficient if it’s impossible to make one agent better off without making at least one other agent worse off. A Pareto improvement is a reallocation that makes at least one person better off without harming anyone else (a “win-win” situation).
Production & Transformation
- Production: The transformation of inputs into outputs. (p. 7)
- Transformation Curve (Production Possibility Frontier): A graph showing the maximum combinations of goods that can be produced with available resources and technology. (p. 8)
- Combinations on the curve are efficient.
- Combinations below the curve are feasible but inefficient.
- The slope of the curve measures the opportunity cost of producing one good in terms of the other.
Trade
- Trade: The voluntary exchange of goods between agents; implies Pareto improvements.
- Coincidence of Wants:
- Direct exchange (good-for-good) requires a double coincidence of wants.
- Indirect exchange (good-for-money-for-good) requires only a simple coincidence of wants.
Gains from Trade
Trade allows parties to specialize and benefit from their productive differences. This is explained by the concepts of absolute and comparative advantage.
Absolute vs. Comparative Advantage
- Absolute Advantage: The ability to produce a good using fewer resources (e.g., less time) than another agent. (p. 10)
- Comparative Advantage: The ability to produce a good at a lower opportunity cost than another agent.
Example: Robinson and Friday (p. 9)
- Two individuals, Robinson and Friday, produce two goods: Fish (F) and Nuts (N).
- They each have 10 hours (600 minutes) for production.
- Production times and opportunity costs are as follows: (p. 11)
| Agent | Minutes/Fish | Minutes/Nut | Opportunity Cost Fish | Opportunity Cost Nut |
|---|---|---|---|---|
| Robinson | 20 | 30 | 2/3 Nut | 3/2 Fish |
| Friday | 15 | 15 | 1 Nut | 1 Fish |
- Analysis:
- Friday has an absolute advantage in both goods (he is faster at producing both).
- Robinson has a comparative advantage in Fish (giving up 2/3 Nuts is cheaper than Friday giving up 1 Nut).
- Friday has a comparative advantage in Nuts (giving up 1 Fish is cheaper than Robinson giving up 3/2 Fish).
Principle of Comparative Advantage
Specialization according to comparative advantages, followed by trade, allows all parties to achieve mutual gains. This holds true even if one party has an absolute advantage in all goods. (p. 14)
- Terms of Trade: For trade to be beneficial, the price must lie between the two parties’ opportunity costs.
- Example: 1 Fish is traded for 7/8 Nuts. This is between Robinson’s cost (2/3 Nuts) and Friday’s cost (1 Nut). (p. 12)
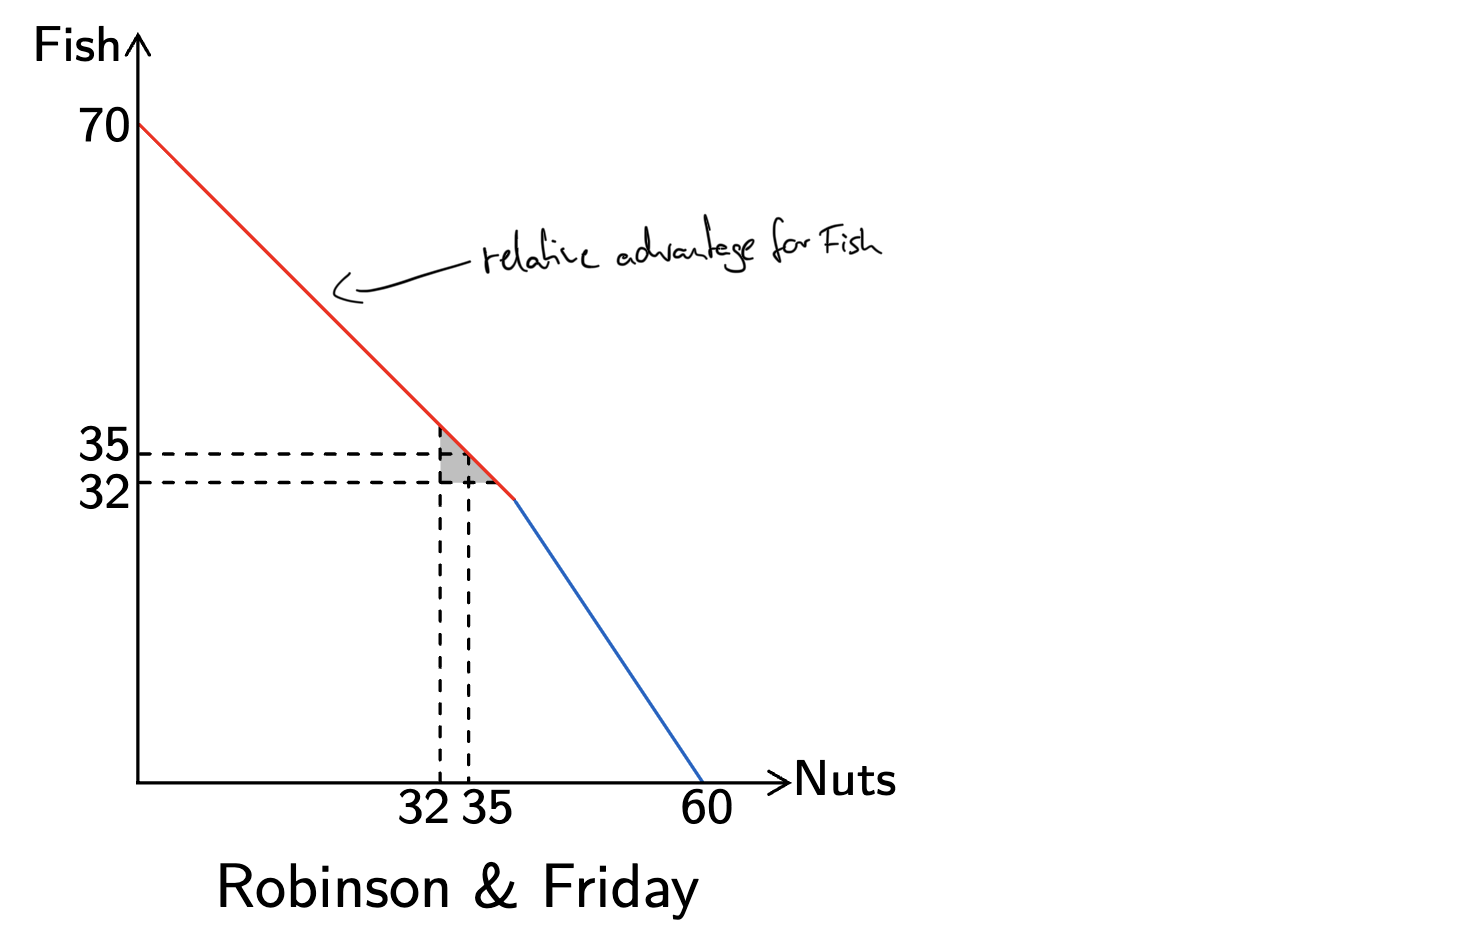
Joint Transformation Curve
- The joint transformation curve shows the total production possibilities for both agents combined. It is formed by having each agent specialize according to their comparative advantage. (p. 13)
- It represents the joint production possibility frontier.
- Example: For Robinson and Friday, the joint transformation curve is described by the following piecewise function, where N is the total nuts and F is the total fish produced.
- Hint: The slopes (-1 and -3/2) represent the opportunity costs of producing one fish vs. one nut. If both produce fish, they’d get a total of 70. Friday can produce up to 40 nuts (N ≤ 40), after which Robinson starts producing nuts (40 < N). The trade-off is higher opportunity cost → a steeper slope. 90 is the theoretical y-intercept of Robinson (N=40, F=30 → 30 = -3/2*40+b). Robinson can produce up to 20 nuts alone (N ≤ 40 + 20).
- If they want to consume equal amounts of both goods (F=N), we can find the optimal point:
- Through specialization and trade, they can jointly produce and consume 35 of each good, an outcome that was not possible under autarky (self-sufficiency).
Example Problem
This is the specialization & trade problem from exercise exam 2 with some questions from exercise exam 1.
3 persons (A, B, C) produce two products (Y, Z). They produce for 24 hours. They have to obtain 1 of Z, and as many of Y as possible. The production times (in hours) per unit are as follows:
| Person | Hours/Y | Hours/Z |
|---|---|---|
| A | 1 | 3 |
| B | 2 | 8 |
| C | 8 | 8 |
Preparation
Opportunity Costs and Comparative Advantages:
| Person | Opp. Y to Z | Opp. Z to Y |
|---|---|---|
| A | 1/3 | 3 |
| B | 1/4 | 4 |
| C | 1 | 1 |
- Comparative Advantage for Y: B ()
- Comparative Advantage for Z: C ()
Autarky:
- Production of Y is
- Production of Z is , as they each need to obtain Z
Questions
At which values of Y or Z does the joint transformation curve have a slope of ?
The slope of -1 occurs when C is the marginal producer, or after the switch from person A to C. This occurs when B and A have produced their maximum possible amounts of Y with no Z, or between 0 and the production capacity of C for Z: , or at .
Check if this combination is located on the joint transformation curve:
Yes. Following the joint PPF, B (comparative advantage) can produce up to 12 Y. If A (next best) produces the remaining 12 Y, A still has capacity for 4 Z. C then produces 3 Z. Total: 24 Y, 7 Z.
With trade terms 2Y for 1Z, how does Y change for each person?
C produces 3 Z due to its comparative advantage (using its entire capacity of 3 Z). After the trade they have this number of Y:
- A: 24, -2 from trade → 22 Y → +1 compared to autarky
- B: 12, -2 from trade → 10 Y → +2 compared to autarky
- C: 0, +4 from trade → 4 Y → +2 compared to autarky
When excluding B, which trade terms would lead to mutual gains?
A’s opportunity cost for 1 Z is 3 Y, C’s opportunity cost for 1 Z is 1 Y.
Therefore, the trade price for 1 Z must be between 1 Y and 3 Y.
If, instead of always wanting exactly 1 unit of Z, each unit of Z must be paired with 2 units of Y in consumption, how many such (2Y, 1Z) bundles can the three persons jointly achieve at most under trade terms of 2Y for 1Z?
Z is the limiting resource, the reduced production capacity outweighs the 2:1 factor. Therefore, C (comparative advantage in Z) produces as much Z as possible: 3. This requires 6 Y, produced by B.
That leaves 24 hours for A and 12 hours for B, which they share to produce additional bundles. If A produces Z an additional 6 Z, requiring an additional 12 Y, of which 6 can be produced by B. This leaves 6 hours for A to produce 6 Y.
Therefore, the maximum number of (2Y, 1Z) bundles is 9 (3+6).
Approaches
Absolute vs. Comparative Advantage
- Identify Absolute Advantage: Determine who produces more output with the same resources or who uses fewer resources (time) to produce one unit of output.
- Calculate Opportunity Costs:
- The opportunity cost of Good 1 is .
- It represents how many units of Good 2 must be given up to produce one unit of Good 1.
- Identify Comparative Advantage: The agent with the lower opportunity cost for a specific good has the comparative advantage in that good.
Terms of Trade (Price)
- Find Beneficial Trade Terms: For trade to be mutually beneficial, the trade price (Terms of Trade) must lie strictly between the opportunity costs of the two parties.
- Calculate Gains from Trade: Compare the consumption levels after specialization and trade to the consumption levels under autarky (self-sufficiency).
Joint Transformation Curve (Joint PPF)
- Construct the Piecewise Function:
- Determine the endpoints: Total production if everyone produces only Good 1 vs. total production if everyone produces only Good 2.
- Identify the “kink” points: Order agents by their comparative advantage. The agent with the lowest opportunity cost for a good produces it first.
- The slope of each segment of the joint PPF is the opportunity cost of the marginal producer for that segment.
- Optimization (Bundle Consumption): If a specific consumption ratio is required (e.g., or a bundle of ), set the production functions equal to the consumption constraint to solve for the optimal quantities.