Resources
- Slides
- Literature: Porter 1996, Rothaermel 2024
Context
This is Step 2 of Strategy Making: Formulation
External Analysis and Internal Analysis assess the strategic position of the company, with a goal of creating performance advantage via value or price superiority, rooted in market position and resource base.
Strategic Thinking
Using a companies competitive advantage (value, price) to go from market position and resource base to a performance advantage (return spread, financial value).
Both views assume market imperfections in information, resources, or opportunistic behavior.
Market-Based View: Based on structure-conduct performance, with market attractiveness and market structure influence as main success drivers.
Resource-Based View: Based on internal resources and capabilities, with resource heterogeneity and immobility as main success drivers.
Operational Effectiveness vs. Strategy
- Operational effectiveness (OE) means performing similar activities better than rivals. This includes efficiency, quality, speed, innovation, and customer responsiveness. While necessary for superior performance, it’s not sufficient to achieve sustainable competitive advantage.
- Strategy is about choosing a different position based on a distinct set of activities (what to do and what not to do).
- The productivity frontier describes the maximum value that can be created at a given cost with current best practices; as firms improve OE, the frontier shifts outward, raising the bar for everyone.
Red Queen Effect
When firms mainly copy each other’s practices and pursue similar positions, everyone “runs faster” but relative positions do not change – this Red Queen effect leads to zero-sum competition with limited value creation
Market-Based View (MBV): Outside-In
The Market-Based View explains performance differences mainly through external factors: The structure and attractiveness of the industry and the firm’s market position (structure–conduct–performance logic).
Key ideas:
- Assumes firms react to industry structure and competitive forces.
- Competitive advantage comes from choosing attractive industries and strong positions within them (e.g., differentiation, cost leadership).
- Focus: External Analysis → industry, competitors, customers, substitutes. This includes PESTEL, industry definition, price/cross-price elasticity, and Porter’s Five Forces.
Resource-Based View (RBV): Inside-Out
The Resource-Based View explains performance differences through internal, firm-specific resources and capabilities that are valuable, rare, difficult to imitate, and non-transferable (VRIN).
Key ideas:
- Assumes resource heterogeneity and limited mobility across firms.
- Strategy is about building, protecting and leveraging unique resources and capabilities over time.
- Focus: Internal Analysis → resources, capabilities, value chain, cost structure.
Over time, the RBV has shifted strategic management from a mainly outside‑in focus on industries to an integrated view that also emphasizes firm-specific internal strengths as equal drivers of competitive advantage (inside‑out).
Strategic Positioning
Strategic positioning means staking out a unique position by performing different activities or similar activities in different ways, creating a distinctive value–cost profile. The three basic types of strategic positioning are:
- Variety-based: focus on a subset of products/services (Etsy for handmade/vintage).
- Needs-based: serve most or all needs of a specific customer group (Ikea for young, price-sensitive).
- Access-based: serve similar needs, but for customers that are accessible in a different way (Carmike cinemas in small towns).
Trade-offs (choosing what not to do) protect a position: certain activities, systems or images are incompatible, so trying to do everything undermines performance.
Fit across activities (reinforcing choices in the value chain) makes strategies harder to imitate: advantage comes from the system of activities rather than single best practices.
External Analysis
This section mainly reflects the market-based view: performance driven by industry structure and market position.
Factors on Revenue and Cost
The company’s environment is separated into macro environment and industry environment. Both influence revenue and cost structures of the company, but only the industry environment is directly influenced by the company.
| Level | What it includes | Influence on firm | Ability to shape |
|---|---|---|---|
| Macro (PESTEL) | Political · Economic · Social · Technological · Ecological · Legal | Indirect via industry context | Very limited |
| Industry | Competitive forces (Porter’s 5) · Demand forces · Suppliers | Direct impact on revenues & costs | Partly shapeable |
VUCA
This was skipped in the lecture and is therefore not relevant for the exam.
Strategizing takes place in environments characterized by VUCA (p. 21):
- Volatility: Highly frequent change with high amplitude (e.g., rapid price swings, demand shocks)
- Uncertainty: Relevant future developments and their impact cannot be reliably known
- Complexity: Many interdependent elements and relationships (markets, technologies, actors)
- Ambiguity: Signals are unclear, and cause–effect relationships are hard to interpret
Macro Environment
External factors on revenue include:
- Competitive forces
- Market demand
- PESTEL environment forces:
- Political
- Economic
- Social
- Technological
- Environmental
- Legal
External factors on cost include:
- Suppliers
- PESTEL environment forces
Defining the Industry
An industry is a group of firms producing products that are close substitutes for each other. Industry boundaries can be defined using quantitative and qualitative approaches.
Qualitative Approach
In the qualitative approach, three main dimensions are considered:
- Substitution: One firm’s production/pricing affects the price that the other firm can charge.
- Customer groups: Firms serving the same customer groups with similar needs are in the same industry.
- Geographic scope: The geographic area in which firms compete can define industry boundaries.
Quantitative Approach: Cross-Price Elasticity
In the quantitative approach, cross-price elasticity of demand is used to define industry boundaries. The cross-price elasticity of demand between two products measures how the quantity demanded of one product responds to a change in the price of another product.
: Change in quantity demanded of product x, : Change in price of product x.
Price Elasticity
The price elasticity of demand observes by the percentage change in demand when the price changes.
- Elastic: |PED| > 1, demand changes more than price → luxury goods
- Inelastic: |PED| < 1, demand changes less than price → necessities
- Unitary: |PED| = 1, demand changes as much as price
Profitability
The profitability potential is the difference between the cost and price of a product or service in an industry.
More precisely, the industry’s profitability potential is shaped by four elements (p. 18):
- Value of the product to the customer: Importance of product to customer; availability and attractiveness of substitutes.
- Bargaining power of customers (buyers): Ability to push prices down or demand more value.
- Bargaining power of suppliers: Ability to raise input costs or reduce quality.
- Intensity of competition among producers: Number of competitors, industry growth, fixed costs, product differentiation.
- Monopoly: producer captures most of the surplus (high profitability potential)
- Intense competition: prices tend toward cost, leaving little surplus
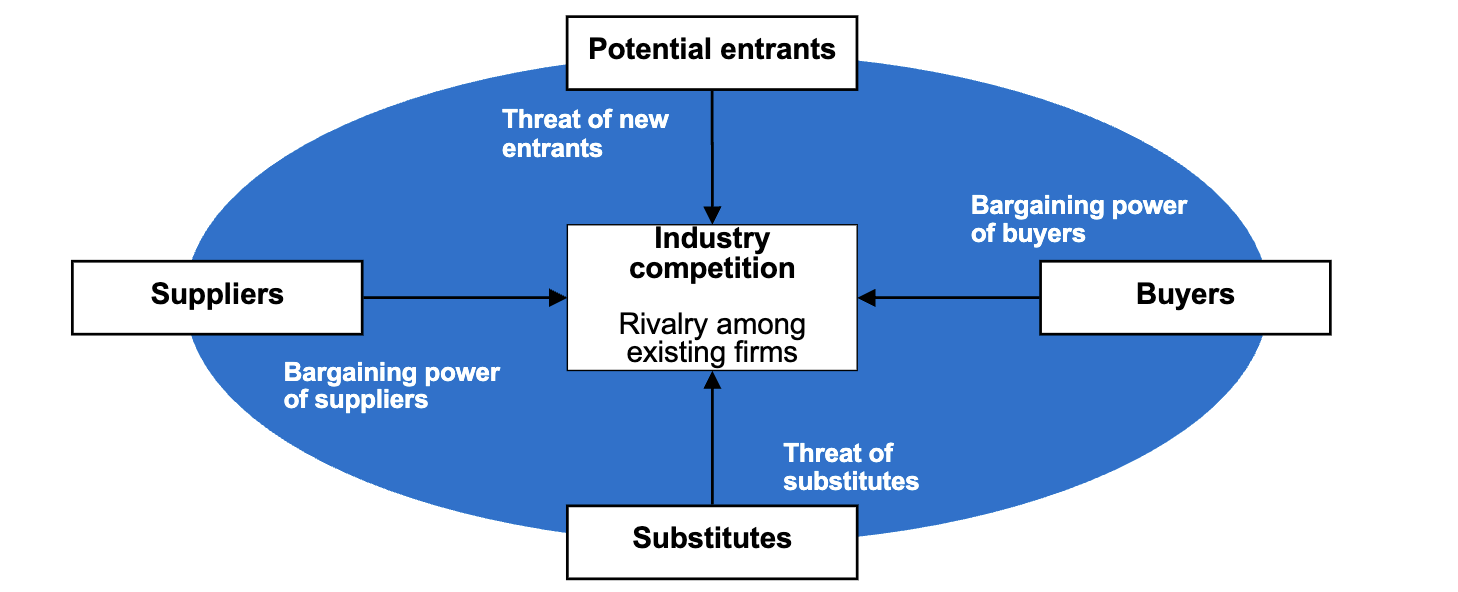
Porter's Five Forces
Porter’s model identifies five forces that determine the competitive intensity and, therefore, the attractiveness and profitability of an industry.
Lower competitive intensity → higher bargaining power → higher profitability.
- Threat of New Entrants can be reduced by economies of scale, product differentiation, capital requirements, switching costs, access to distribution channels, cost disadvantages independent of scale, and government policy.
- Bargaining Power of Suppliers can be fought against by multiple suppliers, vertical integration, or by group buying.
- Bargaining Power of Buyers can be reduced by increasing switching costs, product differentiation, or targeting many small buyers.
- Thread of Substitutes can be mitigated by know-how or patents.
Internal Analysis
This section mainly reflects the resource-based view: performance driven by firm-specific resources and capabilities.
Internal factors on revenue include:
- Value to customer
- Price to customer
Internal factors on cost include:
- Primary value chain processes
- Secondary value chain processes
Resources & Capabilities
The core to any business system are tangible resources (equipment, location) and intangible resources (technology, brand, knowledge). These resources are combined in capabilities (processes, routines) to create value for customers. A capability is the ability to deploy resources via structures, processes, systems.
- Resources
• Tangible – equipment, locations, finances
• Intangible – technology, brand, patents, know-how (p. 26) - Capabilities = ability to deploy/coordinate resources via structures, processes, systems → core competencies
VRIN Model
VRIN tests the core competencies of a firm that can provide sustainable competitive advantage.
- Valuable: Revenues, Cost, Customers for free. Resources that enable a firm to implement strategies that improve efficiency and effectiveness.
- Rare: Not widely possessed by competitors. Resources that are not widely available to competitors.
- Inimitable: Difficult to imitate ot well defendable. Resources that cannot be easily replicated by competitors due to unique historical conditions, causal ambiguity, or social complexity.
- Non-transferable: No equivalent resources. Resources that cannot be replaced by other resources that provide similar value.
Recent literature often calls this VRIO; the ‘O’ (Organization) emphasizing that the firm must be organized to fully exploit valuable, rare, inimitable resources.
A temporary competitive advantage (and thus temporary outperformance) arises when a firm has resources that are valuable and rare, but also easy to imitate or substitute.
Conduct
The conduct of a company refers to the strategic choices and actions taken to leverage its resources and capabilities to achieve competitive advantage. This includes decisions related to building and using resources: The value chain system (product offerings, operational processes) and cost management (cost drivers, cost structure).
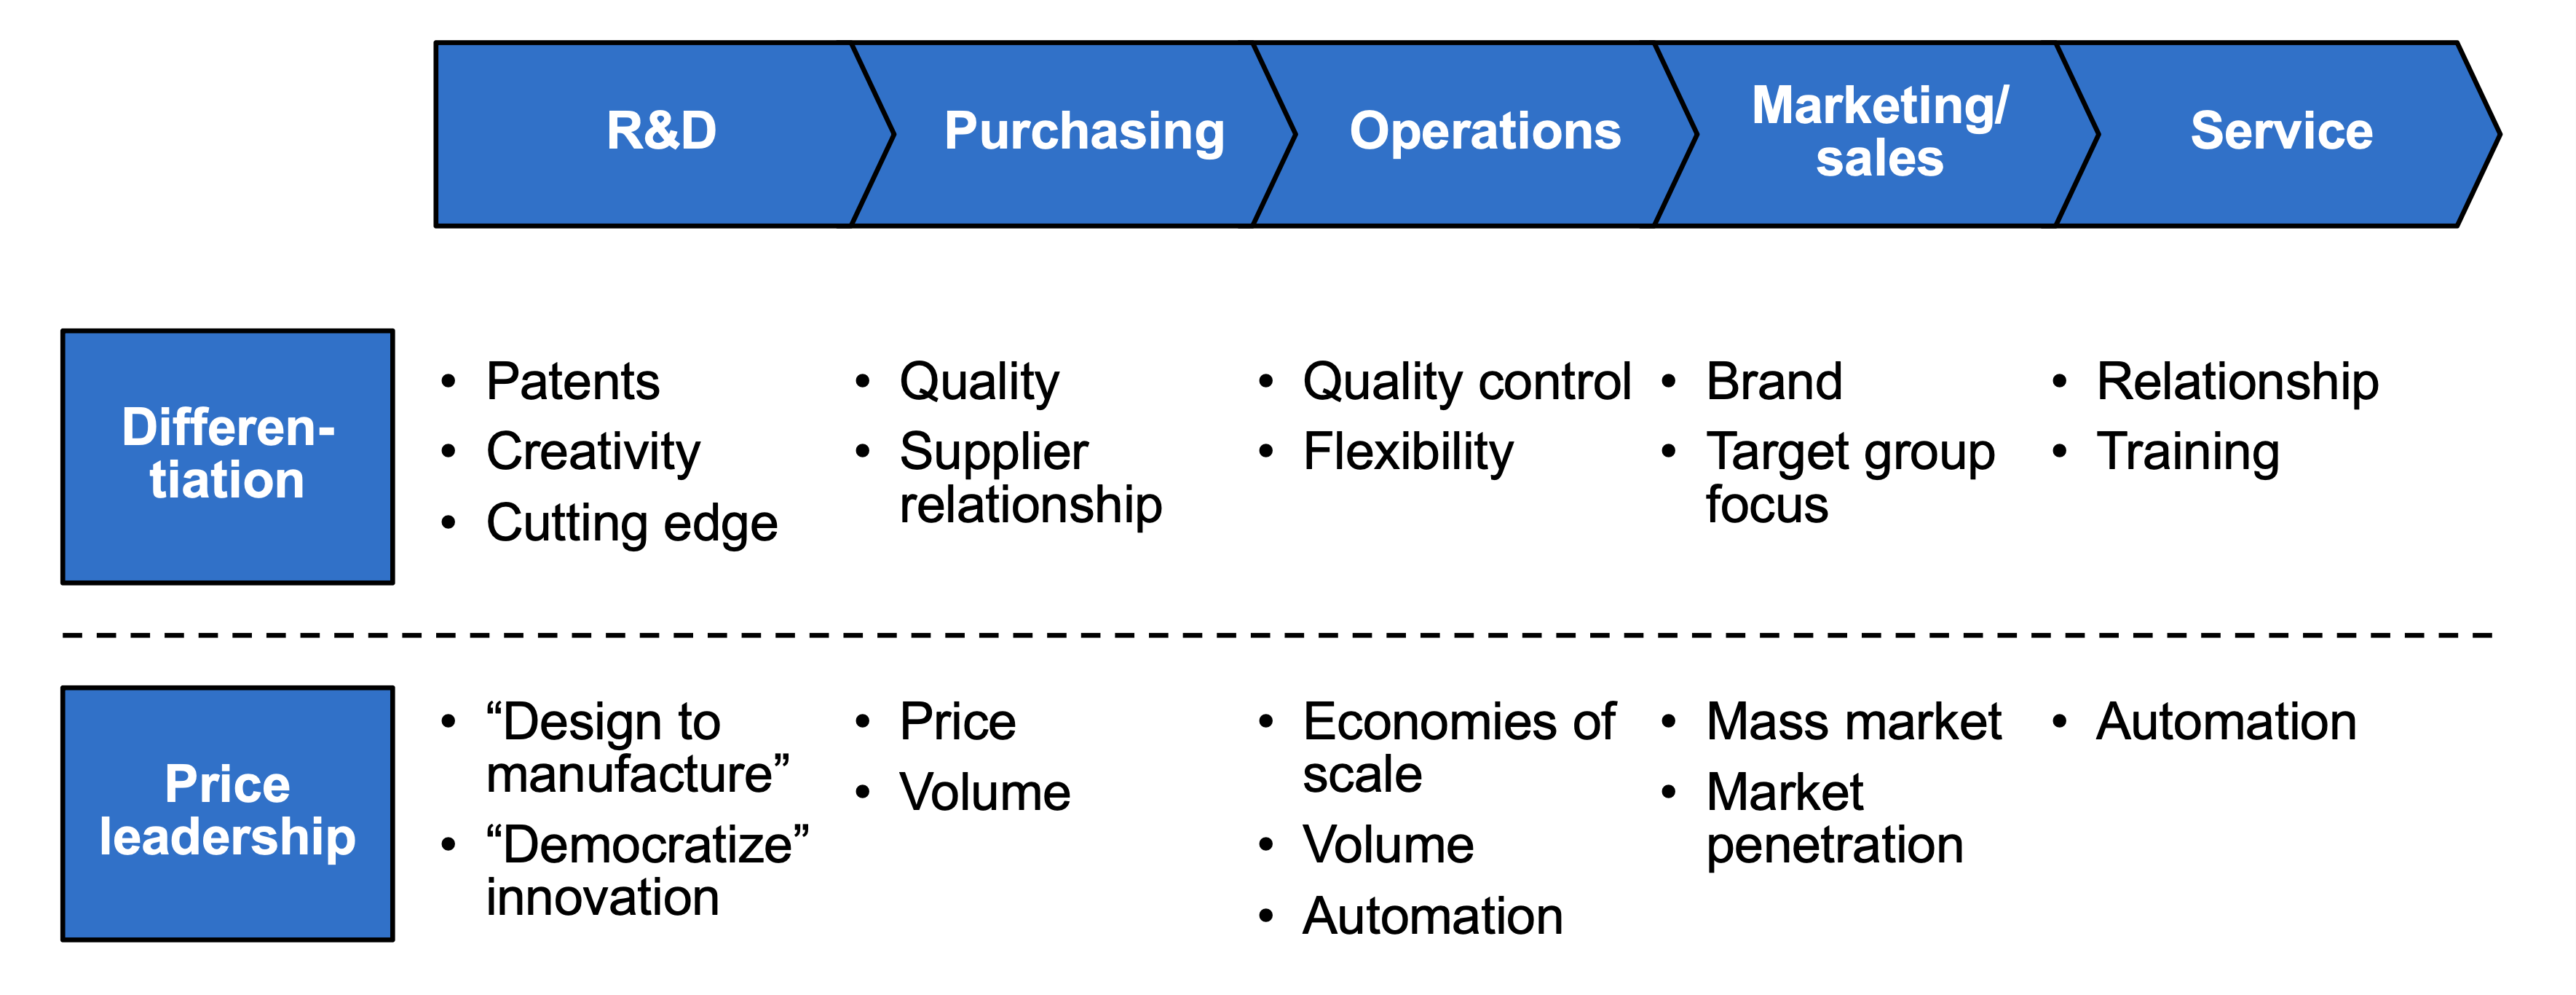
Value Chain
The value chain describes the full range of activities that firms engage in to bring a product or service from conception to delivery and beyond. It is divided into primary activities and support activities.
Different competitive strategies apply to differentiated and price leadership products:
Achieving Cost Advanatges
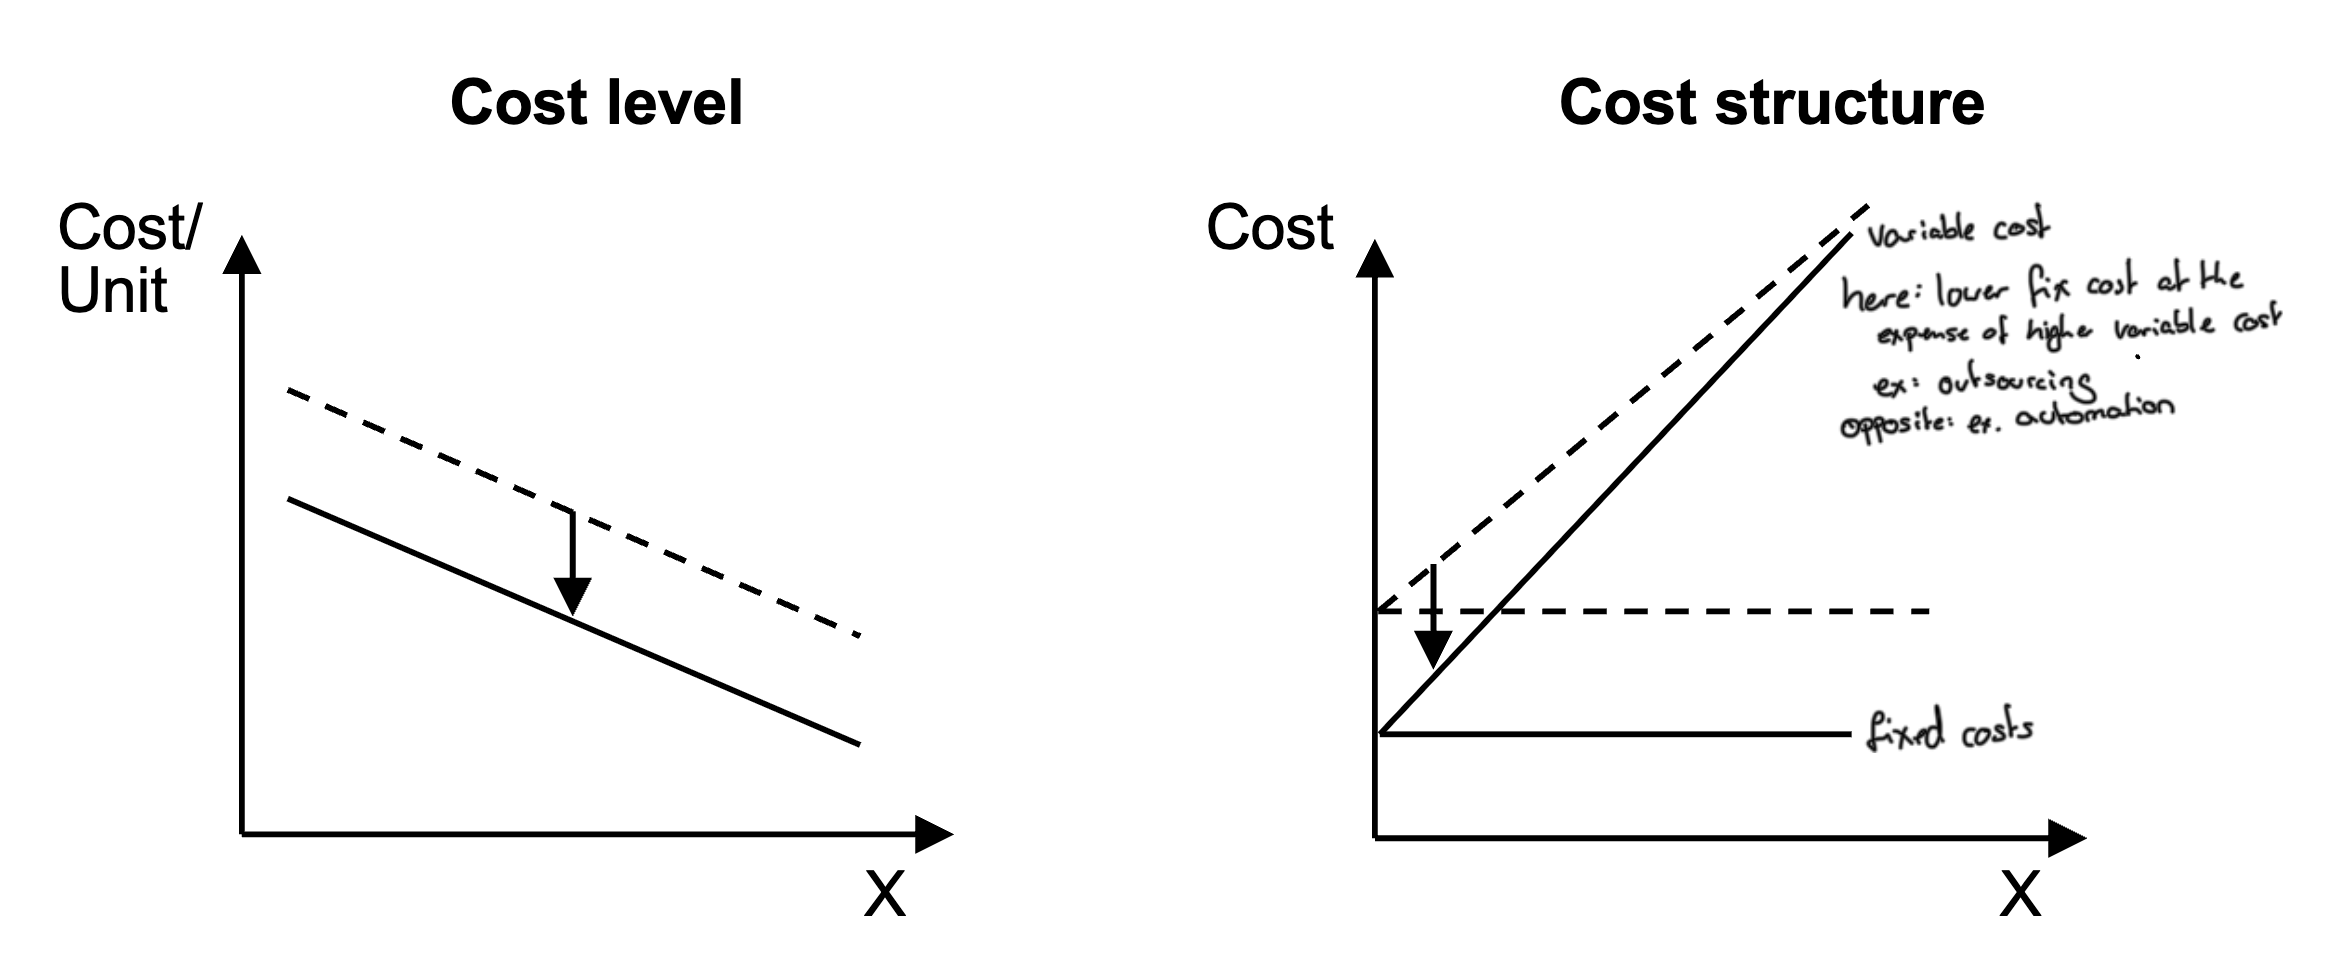
Cost advantages can be achieved either by exploiting structural cost differences or through cost management.
- Structural cost differences arise from economies of scale, economies of scope, and experience curve effects.
- Cost management involves analyzing cost drivers and optimizing the cost structure to reduce costs without compromising value, to be cheaper (cost level) and more flexible (cost structure).
Law of Experience
The law of experience states that the unit cost of a product or service decreases by a constant percentage each time the cumulative production doubles. This is due to learning effects, process improvements, and economies of scale. Typical learning rates are 20–30%.
Cost Management
Cost management constantly improves level and structure of costs. To achieve this, several instruments are used, including:
Activity-Based Costing (ABC): Allocates overhead costs based on activities that drive costs, providing a more accurate picture of product/service costs.
Target Costing: Sets a target cost based on market conditions and desired profit margins, then designs the product/service to meet that cost.
Zero Based Budgeting: Justifies all expenses from scratch, rather than basing budgets on previous periods.
Overhead Value Analysis: Analyzes overhead costs to identify and eliminate non-value-adding activities.
Life Cycle Costing: Considers all costs associated with a product/service over its entire life cycle, from development to disposal.
Cost Benchmarking: Compares costs with industry best practices to identify areas for improvement.
I wouldn’t expect these instruments to be relevant for exams., more general fixed vs dynamic costs
Company & Environment
Skipped
This was skipped during the lecture and should not be relevant for the exam.
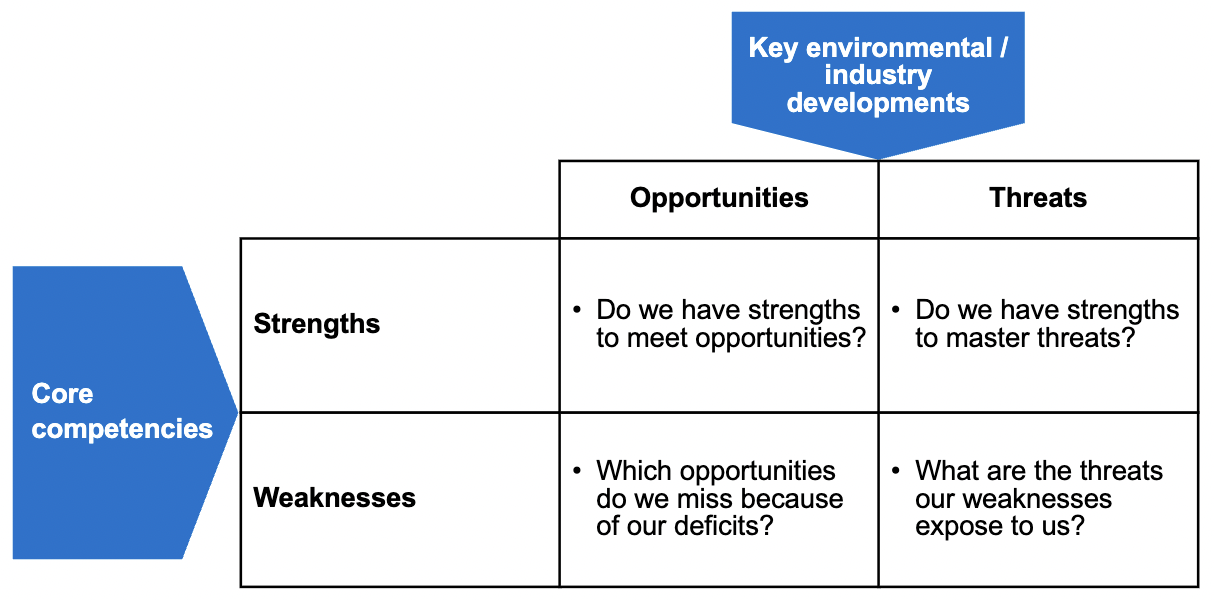
SWOT Analysis
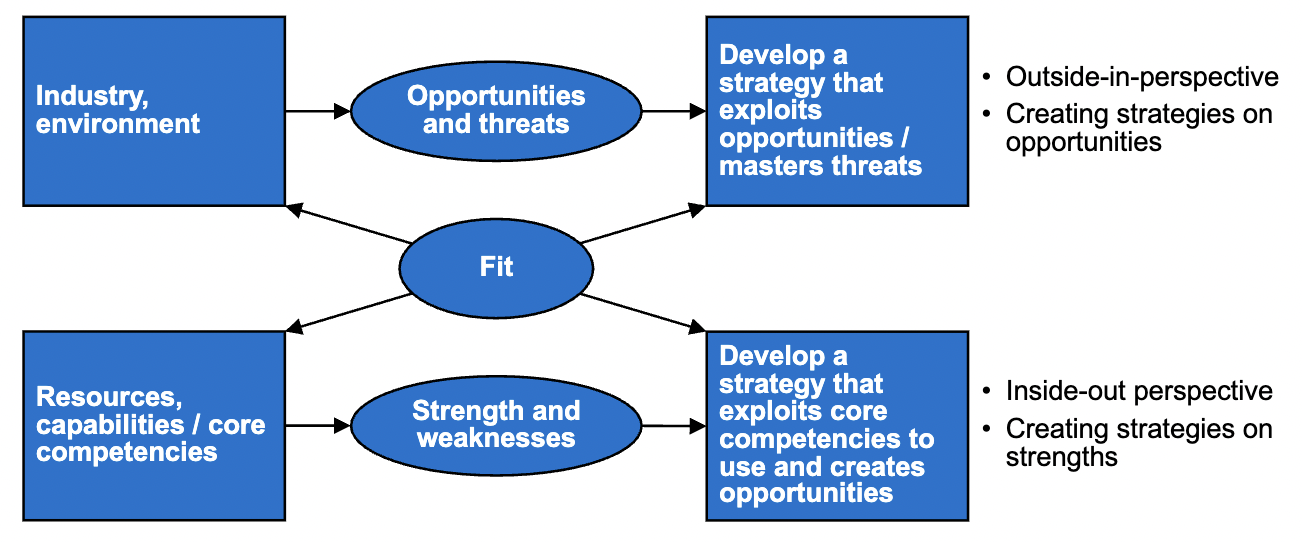
SWOT (Strengths, Weaknesses, Opportunities, Threats) is a strategic planning tool used to identify and evaluate the internal and external factors that can impact a company’s success.
In SIM’s context, SWOT analyzes the interaction of external opportunities/threats and internal strengths/weaknesses, opposed to the traditional SWOT that analyzes them separately.
The analysis aspires to develop strategies that exploit opportunities and master threats (outside-in), employing core competencies and avoiding being exposed to weaknesses (inside-out).
In SIM, SWOT should surface a small set of key issues at the intersection of external O/T and internal S/W; these key issues summarize where the firm’s strategy must focus and which problems/opportunities are most critical to address.
SWOT thereby links the outside‑in MBV view (industry opportunities and threats) with the inside‑out RBV view (resources, capabilities, core competencies) and helps integrate both perspectives (p. 34).
Questions
Exercise 4.1
Question:
The price for Champagne is EUR 5.00 per unit. The demand for Champagne at this price is 50 million units. At the same time, the demand for Wine is 100 million units at a price of EUR 1.00 per unit. When the price of Champagne is reduced by 20%, the demand for Champagne increases by 20 million units, while the demand for Wine decreases by 5 million units. The price for Wine remains unchanged.
Which of the following statements is true?
a) Based on the given information, Champagne and Wine are complements because the cross-price elasticity of demand equals -1/2.
b) Based on the given information, Champagne and Wine are substitutes because the cross-price elasticity of demand equals 4.
c) Based on the given information, Champagne and Wine are substitutes because the cross-price elasticity of demand equals 1/2.
d) Based on the given information, Champagne and Wine are substitutes because the cross-price elasticity of demand equals 1/4.
e) None of the above statements is true.
Correct answer: d
Explanation: The cross-price elasticity is calculated as
indicating they are substitutes. Champagne demand is irrelevant for the cross-price elasticity with respect to wine.
Exercise 4.2
Question:
Which of the following statements is true?
a) Uber can be described as having a competitive advantage based on its tangible resources.
b) Market penetration is a crucial part of the differentiation strategy.
c) A “no frill airline” typically places emphasis on quality and relationship.
d) According to the law of experience, if Company ABC has current unit costs of 1000€ and doubles the cumulative output twice, the unit costs can go down to a value of 490€.
e) The food retailer Aldi is known as an example of a differentiation strategy.
Correct answer: d
Explanation: The law of experience (experience curve) suggests that unit costs decrease with cumulative output, and the calculation fits the typical experience curve reduction.
Exercise 2
Question:
In the lecture, we learned about two major theoretical concepts of strategy, the market- and the resource-based view. Which of the following statements is not true?
a) The resource-based view indicates that rare, valuable, non-transferable and inimitable resources are the main drivers of a company’s success.
b) The market-based view is based on the structure-conduct-performance paradigm.
c) The market-based view assumes that resources are not distributed equally.
d) Both, market-based view and resource-based view are based on the assumption of market imperfection.
e) Opportunistic behavior and non-specific resources are examples of market imperfections.
Correct answer: c
Explanation: The resource-based view, not the market-based view, assumes resources are not distributed equally; the market-based view assumes competitive forces are the main driver.