Resources
Motivation
The ratios of financial statements are the only possibility to compare different companies and serve as a starting point to ask further questions. In a constant economic environment, these ratios can be a good forecast base. Ratios and key figure systems are useful for root-cause analysis and clarify/explain economic relationships and dependencies of business activities.
However, ratios are only meaningful when considered in context, are only based on past and mostly static figures that normally change quickly, and can be manipulated through accounting policies. Partially due to the time-lag between year-end-date, publishing date and analysis date, it’s difficult to derive a forecast based on past key figures. Lastly, these ratios are not legally defined and vary at the discretion of the company.
Basics of Financial Statement Analysis
Purpose & Function
Financial Statement Analysis (also called Balance Sheet Analysis) is the methodological analysis of published financial data (like annual reports) to gain decision-relevant information on the current economic situation and future development of a company (p. 14).
It relies on key figures and key figure systems to evaluate and present comparisons, such as:
- Time comparisons (e.g., year-over-year)
- Business/Industry comparisons (e.g., benchmarking against competitors)
- Target-actual comparisons (e.g., variance analysis)
The analysis focuses on three core areas of a company:
- Net Assets: Provides insights into asset structure, asset turnover, and business growth.
- Financial Position: Sheds light on financing forms, financial risks, and current/future solvency (liquidity).
- Results of Operations: Shows the company’s earnings potential, particularly return on equity and total return on capital.
Business Analysis
Business analysis encompasses both strategic and financial analysis to provide a holistic view of a company’s performance and potential (p. 19).
- Strategic Analysis: Focuses on the potential for success by evaluating market position, competitive advantages (SWOT), and strategy. It analyzes management reports, sustainability reports, press releases, etc.
- Financial Statements Analysis: Focuses on actual success and liquidity by examining historical and current financial performance, solvency, and profitability. It analyzes the core financial statements.
Stakeholder Interests
Different stakeholders analyze financial statements with different objectives (p. 18):
- Creditors, Suppliers, Employees: Focus on financial stability and credit risk. They are concerned with the company’s ability to meet its obligations.
- Shareholders, Investors: Focus on profitability and income risk. They are interested in the return on their investment.
- Internal Stakeholders (Management, Boards): Use the analysis for decision-making, performance evaluation, and control.
Preparation for Analysis
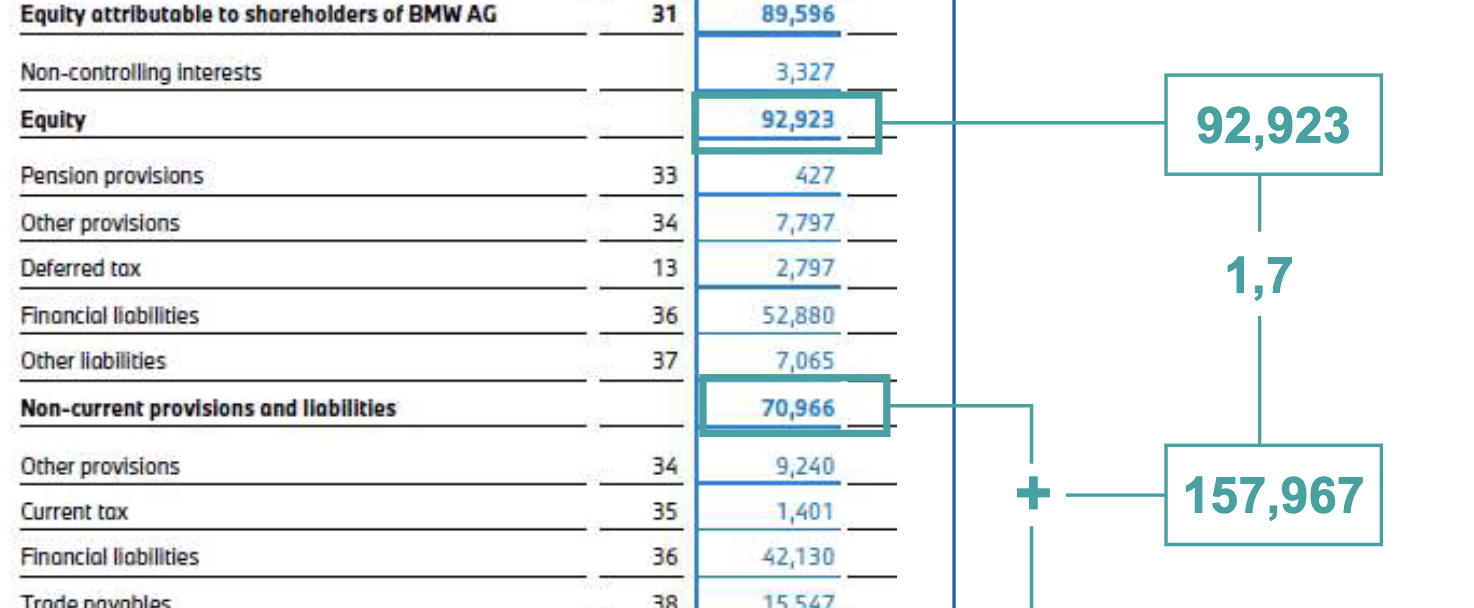
For analysis, especially between-company comparisons, financial statements must be prepared and standardized. This involves restructuring the balance sheet and income statement to fit a uniform format, as companies may use different account titles or levels of detail.
- This process requires analyst discretion to map accounts correctly.
- Example: Mapping BMW Group’s statements to a standardized system to enable comparison with competitors (p. 37, 39).
Mandatory and additional components of financial statements are explained in Financial Statement Components.
Key Figures
Key figures are the primary tools for financial analysis. They can be absolute or relative. The most important figures are Gross Profit Margin and EBIT Margin.
Absolute Key Figures
Absolute figures (e.g., total revenue, net profit) help classify companies by size and conduct basic trend analysis.
- Limitation: Their significance is limited without a benchmark or comparative standard. A €1M profit is great for a small startup but poor for a large corporation.
Evaluation of Figures
Key figures, whether absolute or relative, have little meaning in isolation. Their value comes from comparison (p. 34):
- Within-company comparison: Tracking performance over time (e.g., vs. last year).
- Between-company comparison: Benchmarking against peers or industry averages.
- Target-actual comparison: Measuring performance against set goals.
Relative Key Figures (Ratios)
Ratios relate two absolute figures to each other, revealing cause-and-effect relationships and providing deeper insights.
Underlying Absolute Figures
When presenting a ratio, always provide the underlying absolute figures and their source. There is often no single legally binding way to calculate a ratio, so context is essential for transparency and comparability.
This also means that these figures can be influenced by accounting policies.
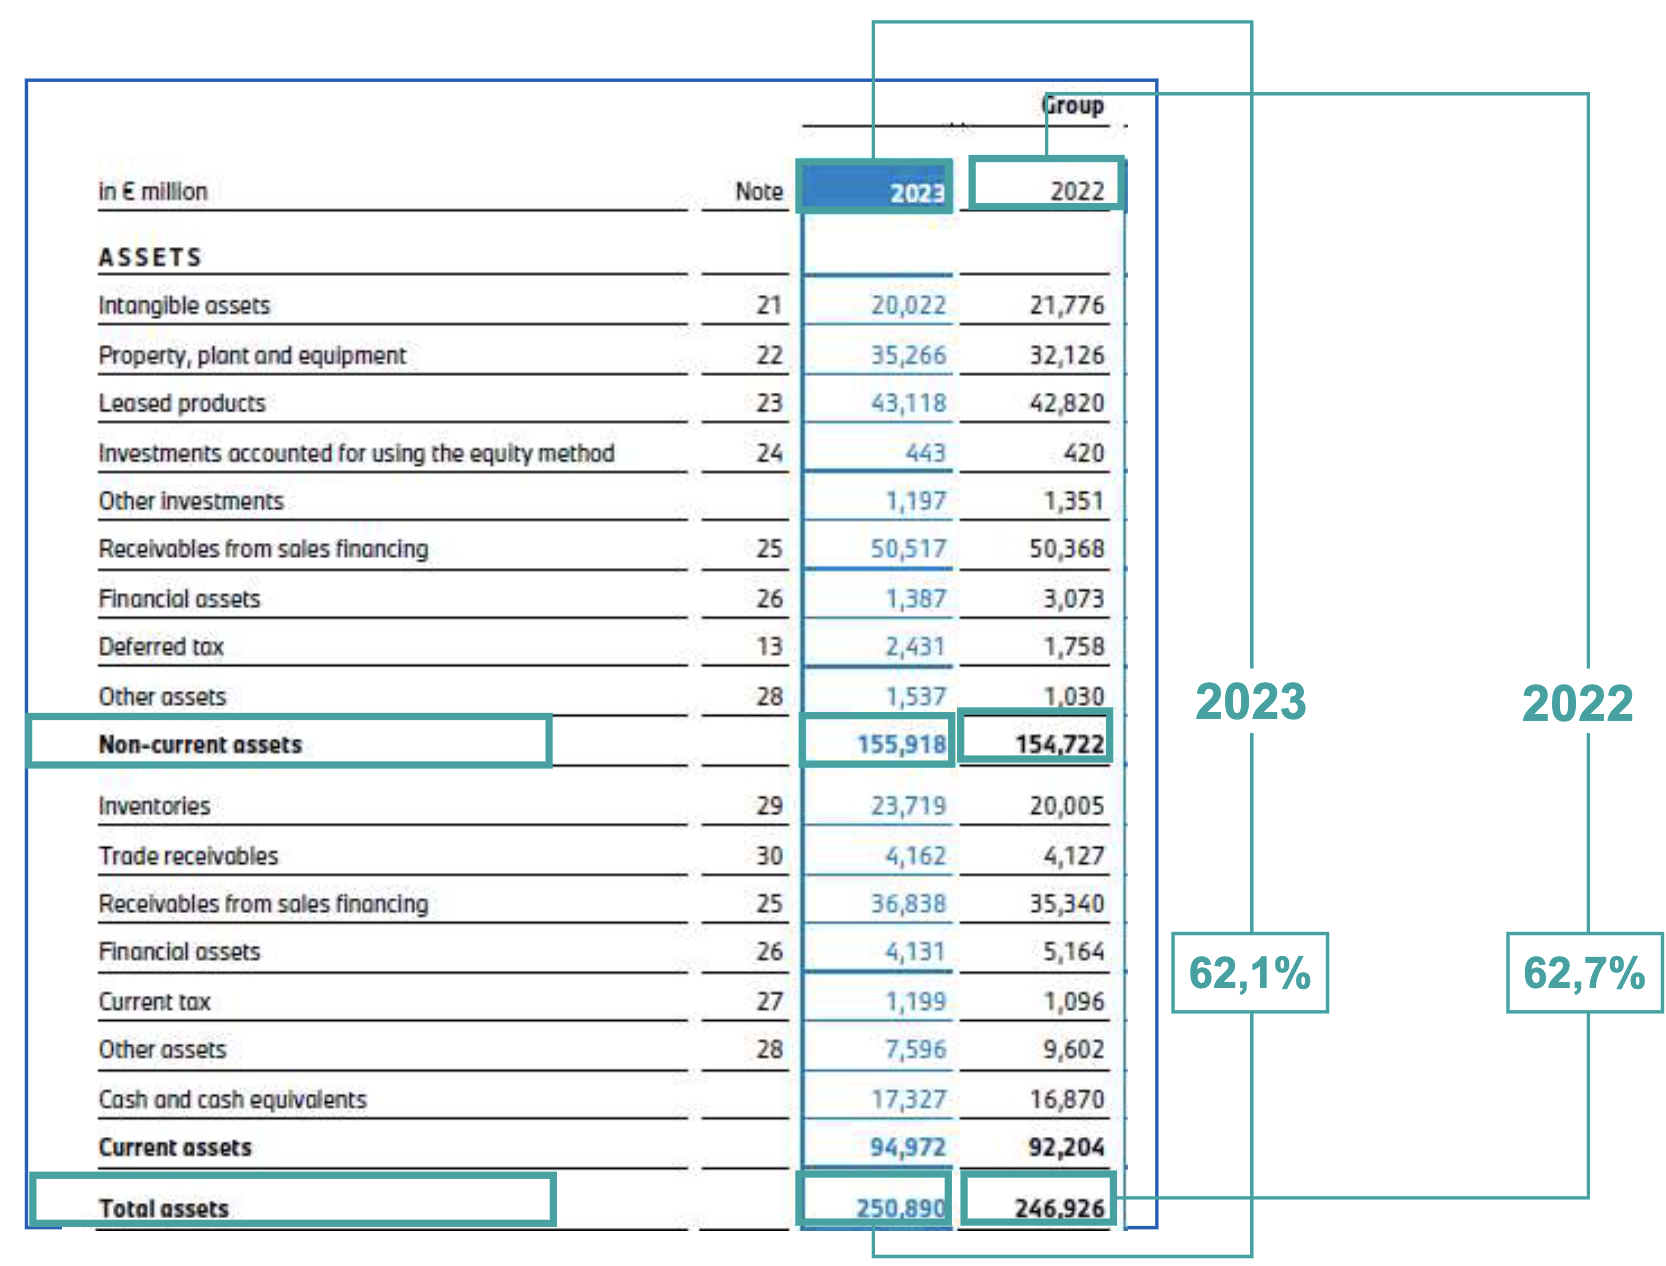
- Breakdown Figures: Compare a part to the whole.
- Example: Non-current assets as a percentage of total assets.
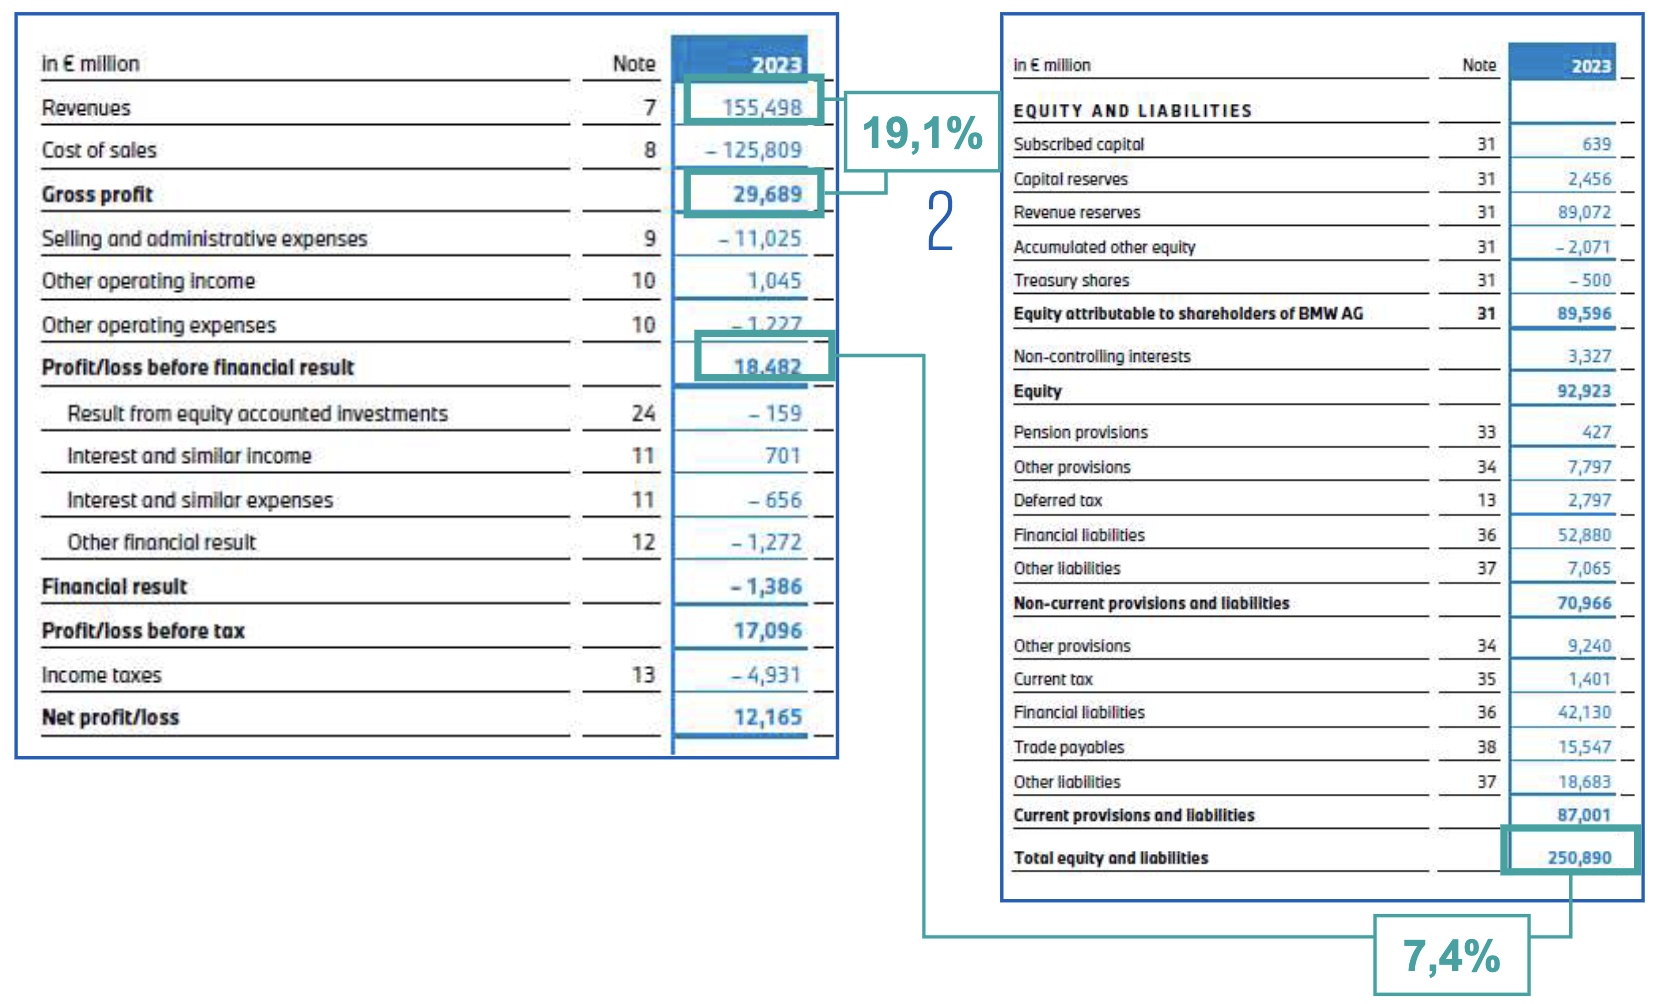
- Relationship Figures: Relate two different types of aggregates that have a logical connection.
- Example: Gross Profit / Revenues (Gross Profit Margin).
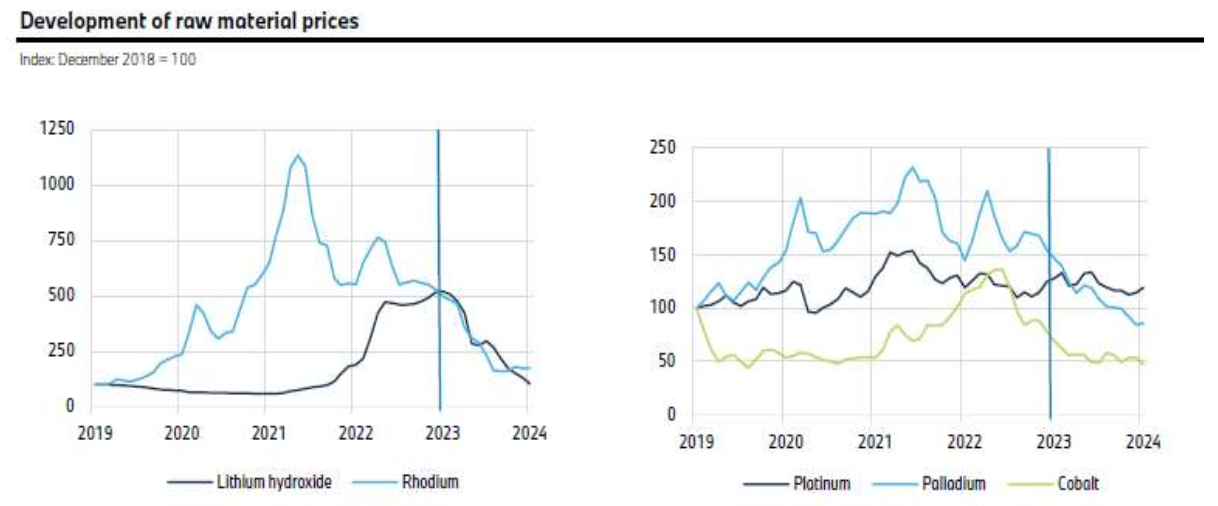
- Index Figures: Track changes over time by setting a base period value to 100.
- Example: Development of raw material prices or stock indices.
- Other Metrics: Compare two similar figures that differ by one characteristic.
- Example: Debt / Equity.
Breakdown Figures
Component Analysis: Comparison of partial to total sizes (breaking down total size into components)
Examples: Non-current assets, Total assets, Liabilities, Total equity and liabilities
Relationship Figures
Financial Ratios: Comparison of two sizes in relation to each other: ratio of different aggregates in a logical context.
Examples: Profit before financial result / Total equity and liabilities, Gross profit / Revenues
Index Figures
Time-Based / Trend Analysis: Comparison of sizes over time by setting a base value (100%) and expressing subsequent values relative to this base. Useful for temporal changes in a size.
Examples: Stock indices, Exchange rate indices, Raw material indices
Other Metrics
Valuation & Non-Financial: Ratio of equally ordered sizes that differ by one characteristic (e.g., time period, company, industry).
Example: Debts / Equity
Financial-Based Analysis
Analyzes the balance sheet and cash flow statement to assess a company’s financial health and stability.
Determining Future Solvency
Financial-based analysis includes investment, financing, and liquidity analysis to assess a company’s ability to meet its obligations now and in the future. It focuses on the balance sheet and cash flow statement, where assets are read as investments and liabilities as financing.
Balance Sheet Ratios (Point-in-Time Analysis)
Analysis of the balance sheet can be vertical (structure) or horizontal (liquidity).
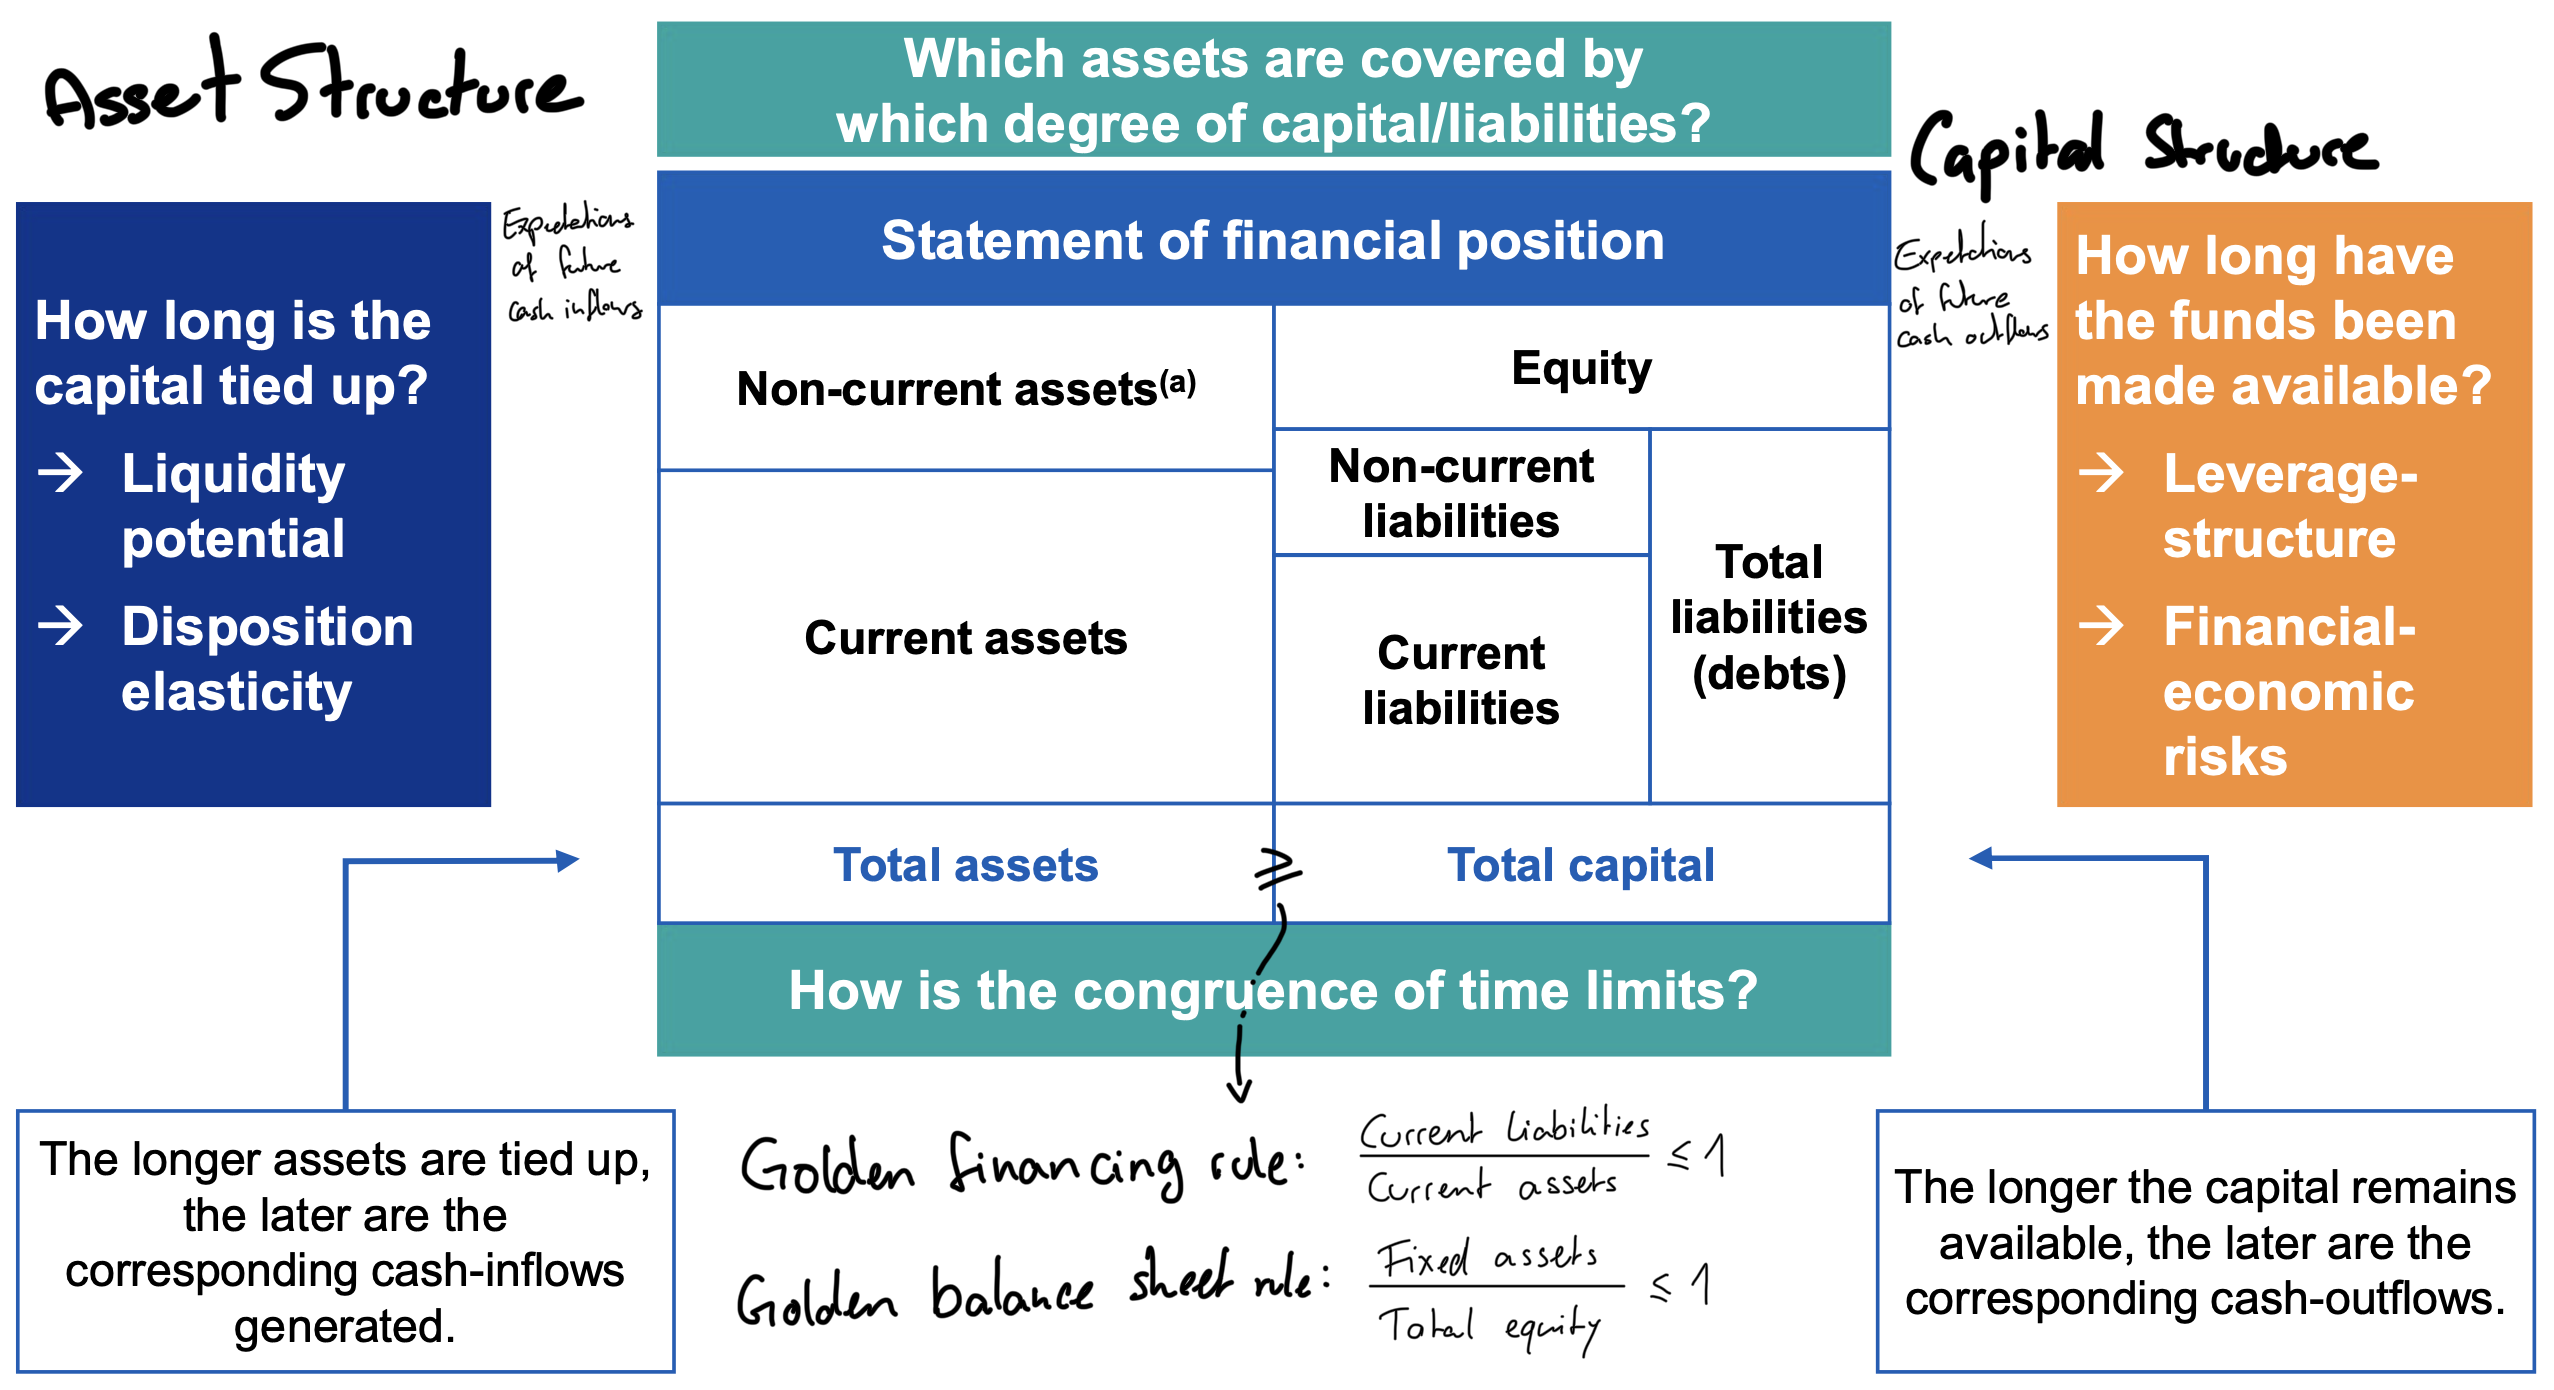
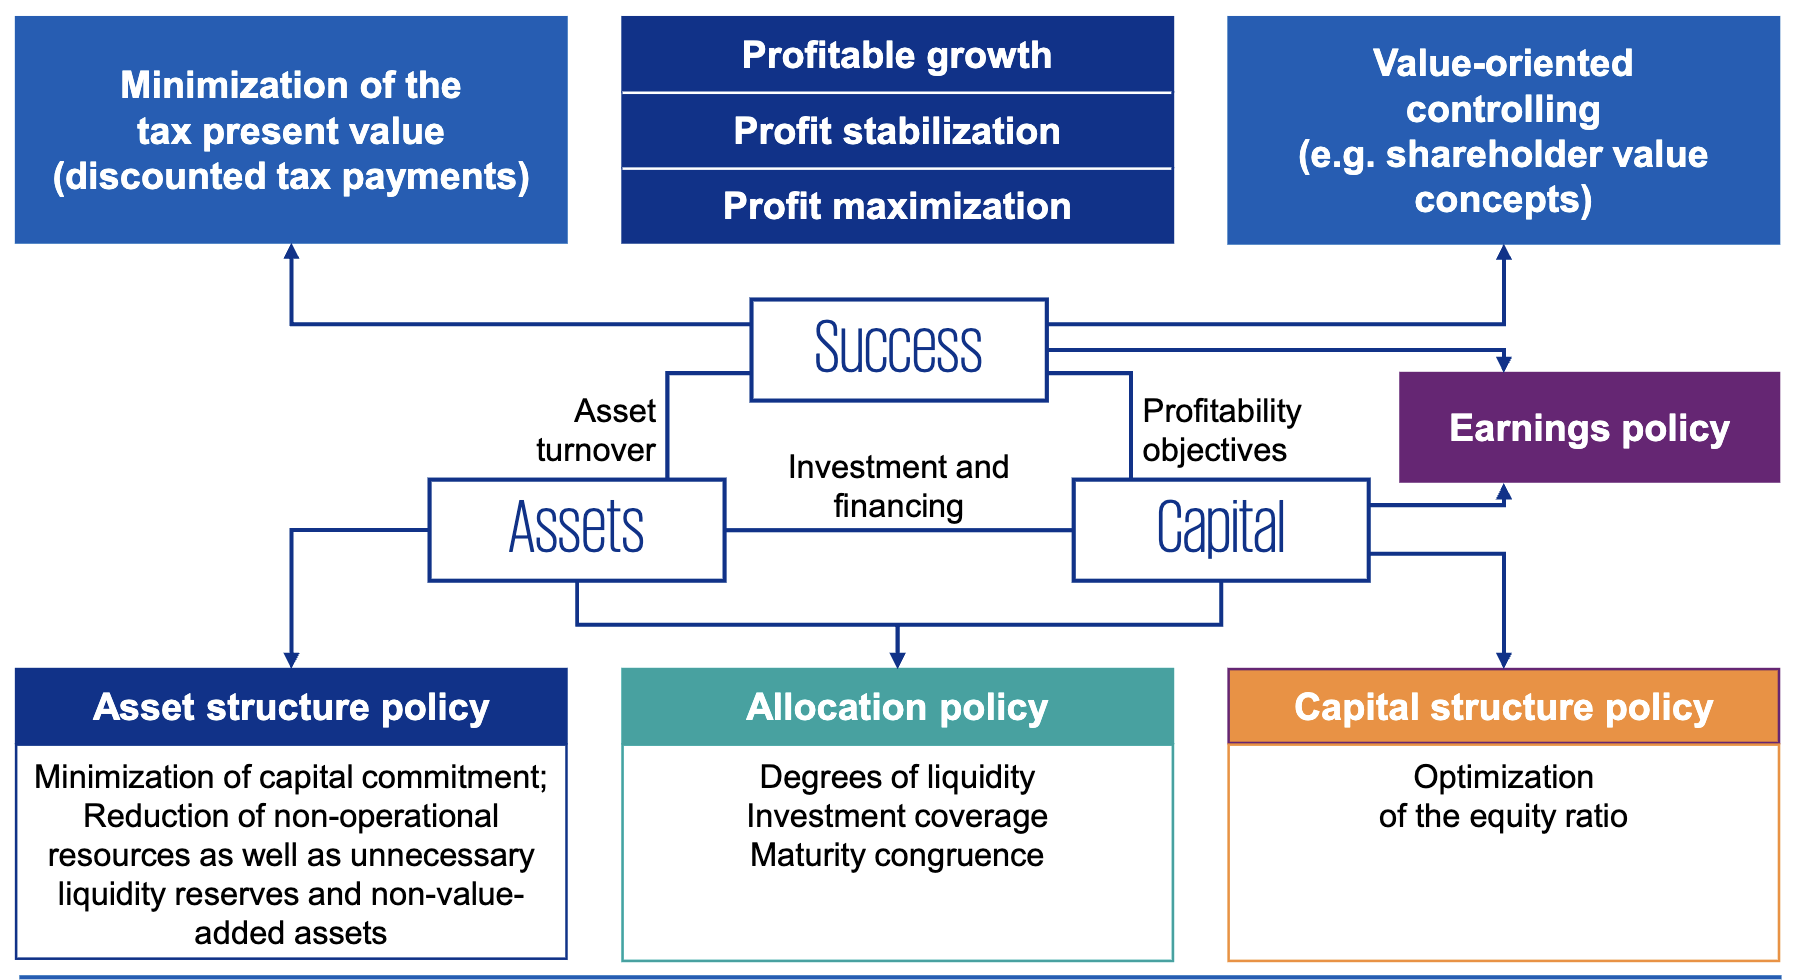
Vertical Structure Analysis
Examines the proportion of individual items relative to a total (e.g., total assets or total capital).
- Asset Structure (Investment Analysis): How are the company’s assets invested?
- Capital Structure (Financing Analysis): How is the company financed?
Asset Structure: Investment Analysis
| Measure | Definition | Interpretation |
|---|---|---|
| Fixed Asset Intensity | The companies ability to adapt to a changing market – relative to its industry. Higher: More financial funds are locked for longer → Higher associated fixed costs Lower: Less capital is tied up long-term | |
| Current Asset Intensity | Capital % locked up in current assets. High is generally positive: current assets can be liquidated quickly. Extremely high may indicate excessive stock, pushing storage cost. More detailed analysis should detail level of receivables and inventory. | |
| Asset Structure | Indicator for stability or flexibility, relative to the industry. Lower: Either the low level of fixed assets allows for more flexibility and lower fixed costs (shorter capital lock-up for assets), or the company’s assets have already been written off, which could imply it’s using out-of-date technology. | |
| Fixed Asset Structure | ^ | |
| Fixed Asset = Intangible Asset + PPE (property, plant, equipment) + Leased Assets |
Asset Structures by Industry
Different industries have different typical asset structures that companies should be compared against.
Industry Fixed Asset Intensity Current Asset Intensity Traffic 69% 31% Energy 43% 57% Manufacturing 37% 63% Trade 31% 69% Construction 8% 92%
Capital Structure: Financing Analysis
| Measure | Definition | Interpretation |
|---|---|---|
| Equity Ratio (Intensity) | Higher: Better credit-worthiness, financial stability, independent from lenders. However, equity is more expensive than debt, high equity depresses return on capital. Often >25% required by banks. | |
| Debt Ratio (Leverage Intensity) | Should be considered together assets. If these include hidden liabilities due to lower market values, this has a negative impact on the leverage ratio. | |
| Leverage Structure | What % of liabilities will lead to short-term cash outflow. Higher: Typically observed for companies with higher risk of insolvency, but should be analyzed along all liability maturities and conditions. | |
| Debt Gearing Ratio (Static) | Debt vs. Equity financing. Higher: More dependant on external creditors. Must always be considered with earnings position (leverage effect) > 100% is often considered highly leveraged, but changes by industry | |
| Reserve Intensity | Higher: Offers security to creditors for existing and additional loans. Decrease over time: May eventually lead to total loss of equity and endanger existence | |
| Provision Intensity | Long-term provisions may have an equity structure, though being liabilities. Financing by pension equivalents is possible by immediately registering the expense and postponing the cash-outflow. In the meantime, the capital is available. |
Static Liquidity: Horizontal Structure Analysis
Assesses whether a company can meet its short-term obligations at the balance sheet date.
Static Liquidity Analysis is composed of:
- Investment coverage: Long-term assets / long-term capital
- Congruence structure: Short-term assets / short-term capital
Golden Balance Sheet Rule — The most important rule
Investment coverage: This ratio demands that the capital lock-up period does not exceed the financing period. Long-term assets should be financed with long-term capital.
Not fulfilling this rule may lead to forced asset sales or refinancing at unfavorable conditions.
Long-term capital may be defined as equity exclusively, or include non-current liabilities.
Golden Financing Rule
Principle of matching maturity: Obtaining/repaying and the use of capital should be matched in terms of maturity. Capital may not be tied up in assets for longer than its financing period. Otherwise, a loan may be due before the income required is generated.
Asset Coverage Ratio
The degree to which fixed assets are covered by long-term capital. Counterpart to the investment coverage ratio.
Higher: Better, parts of current assets are also financed long-term and available for liquidity.
Liquidity Ratios
These ratios are crucial for evaluating short-term financial health.
| Measure | Definition | Interpretation |
|---|---|---|
| 1st Degree: Cash Ratio | 50% is healthy, few companies reserve >100%. Less is common but could be an indicator for cash flow risks. | |
| 2nd Degree: Quick Ratio | Should exceed 100%. Often used by banks. Excludes inventory as it may not be converted into cash quickly. | |
| 3rd Degree: Current Ratio | Less than 100% is often considered to threaten the company’s existence. |
Other Key Balance Sheet Figures
| Measure | Definition | Interpretation |
|---|---|---|
| Working Capital | Proportion of assets working (i.e. generating sales) without generating capital cost; current assets with long-term financing. Higher: More secure liquidity position. Negative: Positive for analysts; suppliers pre-finance company’s sales. | |
| Net Debt | Debt if all liabilities were repaid using liquid funds. Negative: Debt-free company exploiting leverage effect, but high level of cash brings low return and bad from an investors perspective. Should be considered with cash flow (dynamic gearing). |
Dynamic Liquidity Analysis: Cash Flow Ratios
Analyzes liquidity over a period, providing a more dynamic view than the static balance sheet ratios.
Free Cash Flow (FCF)
Cash available after the company has paid for its operating expenses and capital expenditures. FCF shows the cash available to be distributed to investors (interest, dividends) or to reduce debt.
Dynamic Debt Gearing Ratio
Measures how many years it would take to repay all net debt using the free cash flow. A value greater than 10 or being negative for several periods can signal insolvency risk.
Cash Flow Statement Figures
Cash flow statement structure on slide 135, including:
- Net Cash Flow / Operating Cash Flow: Cash generated from core business operations.
- Investment Cash Flow: Cash used for investing in long-term assets.
- Financing Cash Flow: Cash from transactions with owners and creditors.
- Free Cash Flow: Cash available after maintaining or expanding the asset base.
- Net Cash Flow: Net Change in Cash and Cash Equivalents, Overall change in cash position. (some exercises call this “Net Change in Cash and Cash Equivalents”)
| Measure | Definition | Interpretation |
|---|---|---|
| (Cash Flow Margin) | What share of total sales is available for investments / credit redemption / dividend payments. Also meaningful for earnings and financing power, context for EBIT margin. |
Performance-Based Analysis
Analyzes the income statement to assess profitability and operational efficiency.
Determining Future Liquidity
Performance-based analysis includes earnings sources, earnings structure, and profitability analysis to evaluate a company’s ability to generate profits and cash flows in the future. It focuses on the income statement, where revenues and expenses are recorded.
- Earnings Analysis: Analysis of income statement to determine profitability, earnings sources, and earnings structure.
- Profitability Analysis: Connects income statement and balance sheet to evaluate how effectively resources generate profit.
Key Earnings Figures
These figures show profit at different stages of the company’s operations. (p. 125)
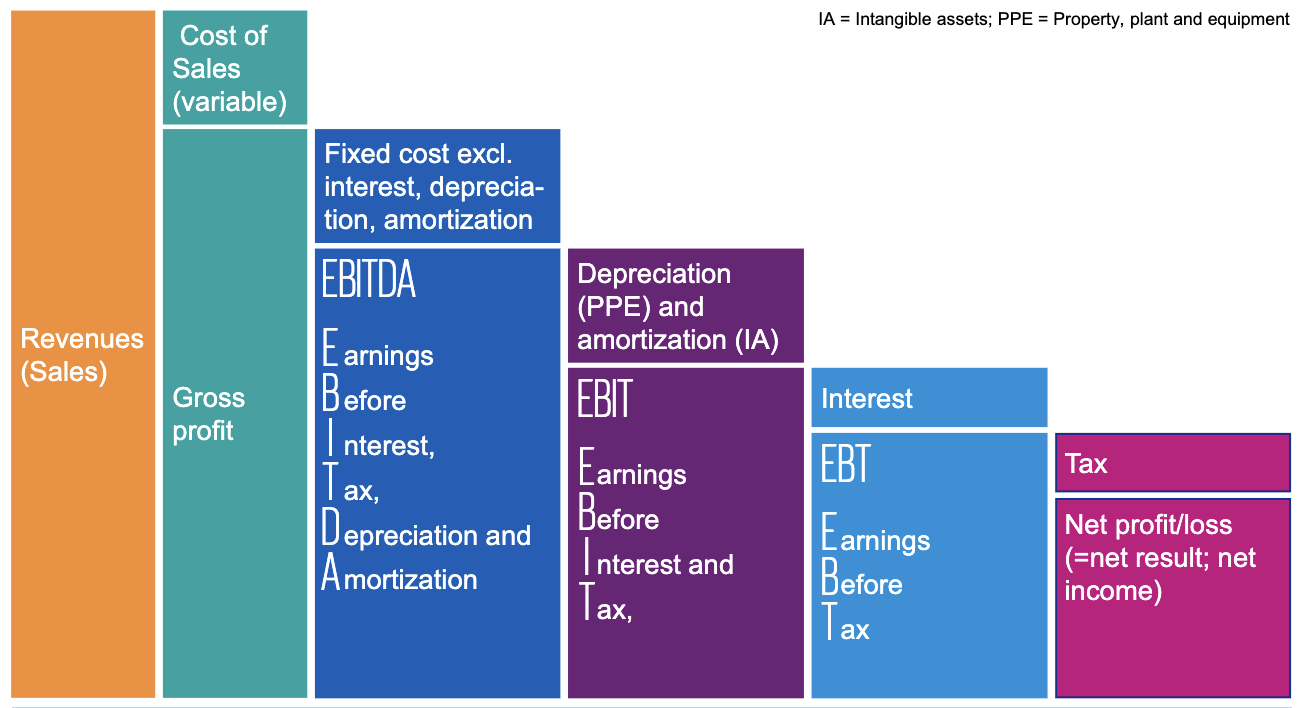
- Revenue: Total income from sales of goods/services.
- Gross Profit:
Revenues - Cost of Sales (COGS) - EBITDA:
Gross Profit - Fixed Costs (exl. interest, deprecation, amortization)Earnings Before Interest, Taxes, Depreciation, and Amortization. A proxy for operating cash flow. - EBIT:
EBITDA - Depraction and AmortizationEarnings Before Interest and Taxes. Also known as operating profit. It measures the profit generated from core operations. - EBT:
EBIT - Interest ExpensesEarnings Before Taxes. - Net Income:
EBT - TaxesThe “bottom line” after all expenses, including interest and taxes, are deducted.
Segment Reporting
Segment reporting breaks down financial performance by different business areas or geographical regions. This allows for a more detailed analysis of which segments are contributing to overall profitability and growth. It can enable a more accurate assessment of opportunities and risks of heterogeneous businesses.
While not a mandatory statement in accordance with IFRS, its an obligatory part of the notes.
Key Segment Figures
- Revenues Contribution Ratio: Group income share generated by each segment;
- EBIT Contribution Ratio: Group EBIT share generated by each segment;
- Profit Contribution Ratio: Group net income share generated by each segment;
Earnings Structure Analysis
This involves breaking down the income statement to understand the composition of revenues and costs. The structure depends on the accounting method used.
Presentation Methods (p. 115)
- Cost of Sales Method: Groups expenses by function (production, selling, admin). This is common internationally and clearly shows the Gross Profit.
- Total Cost Method: Groups expenses by nature (materials, personnel). This is common in Germany and obscures the gross profit, instead showing “Operating Performance”.
Income Statement Ratios (Profitability Margins)
These ratios measure how efficiently a company converts revenue into profit.
| Measure | Definition | Interpretation |
|---|---|---|
| Gross Profit Margin | Profit contribution of products/services sold. Growth indicates how procurement prices change. Offers information on possible price cuts if necessary. | |
| Operating Profit Margin (EBIT Margin) | Profit contribution of operating activities before financial performance. Indicates earnings power (and its development). Useful for cross-industry international comparisons. Higher: Stronger impact of sales on earnings. Negative over periods: For established companies, business model should be reconsidered. | |
| Net Profit Margin | The ultimate measure of profitability after all costs. Shows how much of each dollar in revenue is kept as profit. |
Cost of Sales Method: Earnings Structure Ratios
| Measure | Definition | Interpretation |
|---|---|---|
| Production Cost Ratio | Share of manufacturing costs in revenues | |
| Selling & Distribution Cost Ratio | Importance of selling and distribution in generating sales | |
| Administrative Cost Ratio | Importance of general administrative in generating sales | |
| (Research Cost Ratio) | Importance of research |
Total Cost Method: Earnings Structure Ratios
| Measure | Definition | Interpretation |
|---|---|---|
| Material Expense Ratio | Manufacturing depth and dependence on suppliers | |
| Personnel Expense Ratio | Dependence of the performance on personnel cost, and how economically labor is being employed | |
| Deprecation Ratio | Wear & tear of fixed assets | |
| (Tax Rate) | Reference to tax burden and design of tax |
Profitability Analysis
Connects the income statement with the balance sheet to show how effectively the company is using its resources to generate profit.
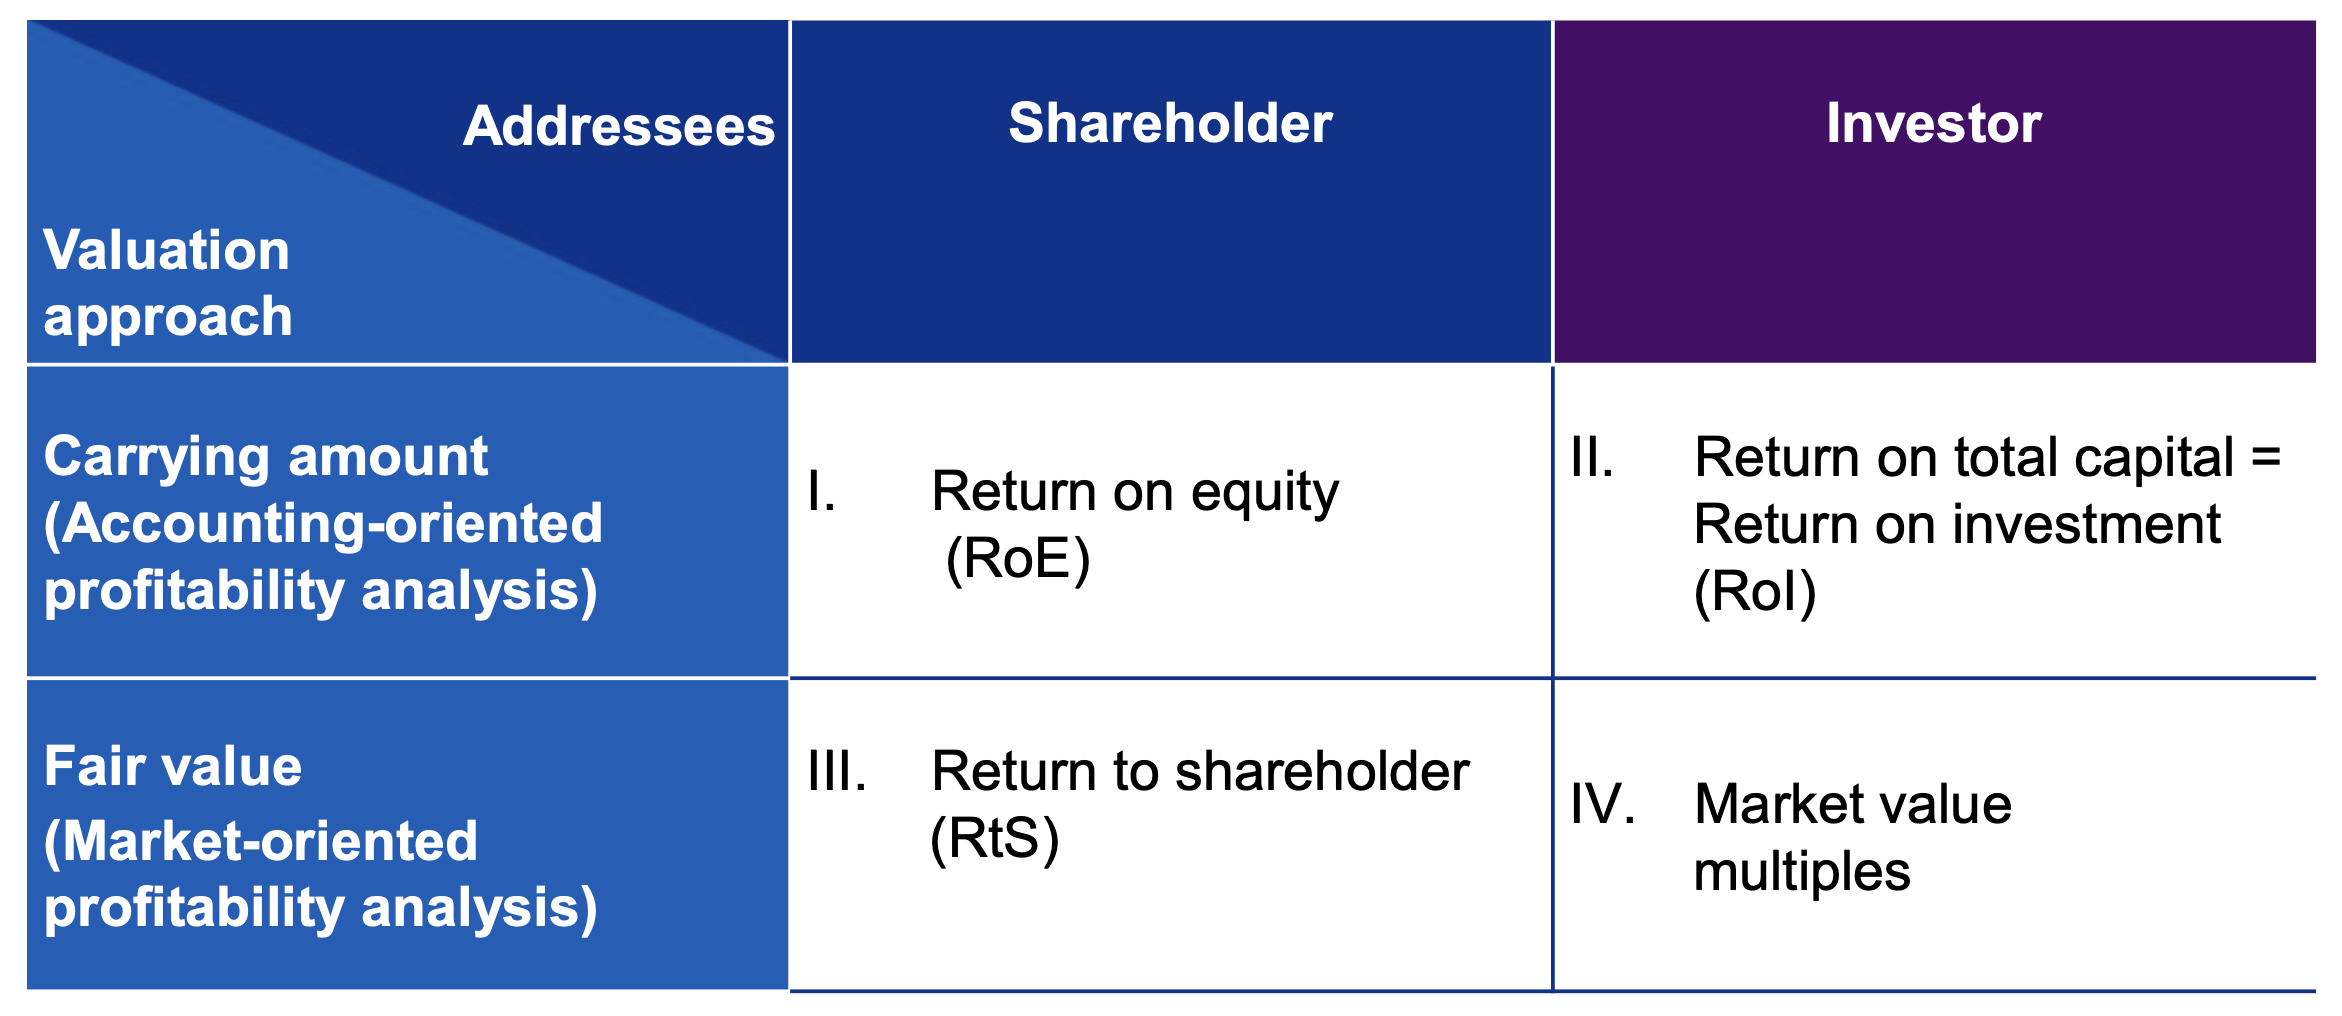
Return Ratios
RoE: Accounting-Oriented Shareholder Perspective
Calculates the return generated on shareholders’ equity.
| Measure | Definition | Interpretation |
|---|---|---|
| Return on Equity (RoE) | How much income is earned for shareholders on invested capital. Target must be capital market interest rate + industry-dependent risk premium, often 5–10%. Given constant profits, lower equity used is better (leverage effect) | |
| (Return on Assets, RoA) | How profitable a firm uses its assets. |
RtS: Market-Oriented Shareholder Perspective
Determines the total return to shareholders, considering both dividends and share price appreciation.
| Measure | Definition | Interpretation |
|---|---|---|
| Return to Shareholder (RtS) | Total return ratio in form of dividends and share price increase |
y.e. price: year-end
RoI: Accounting-Oriented Investor Perspective
Assesses the profitability of all capital employed in the business.
| Measure | Definition | Interpretation |
|---|---|---|
| Return on Investment (RoI) Compared to capital | Interest on capital used. Often a starting point for all further analysis & profitability indicators, | |
| (Return on Capital Employed, RoCE) | or simpler: | Profit on long-term external financing. However, bsaed on residual book values, so will always increase. |
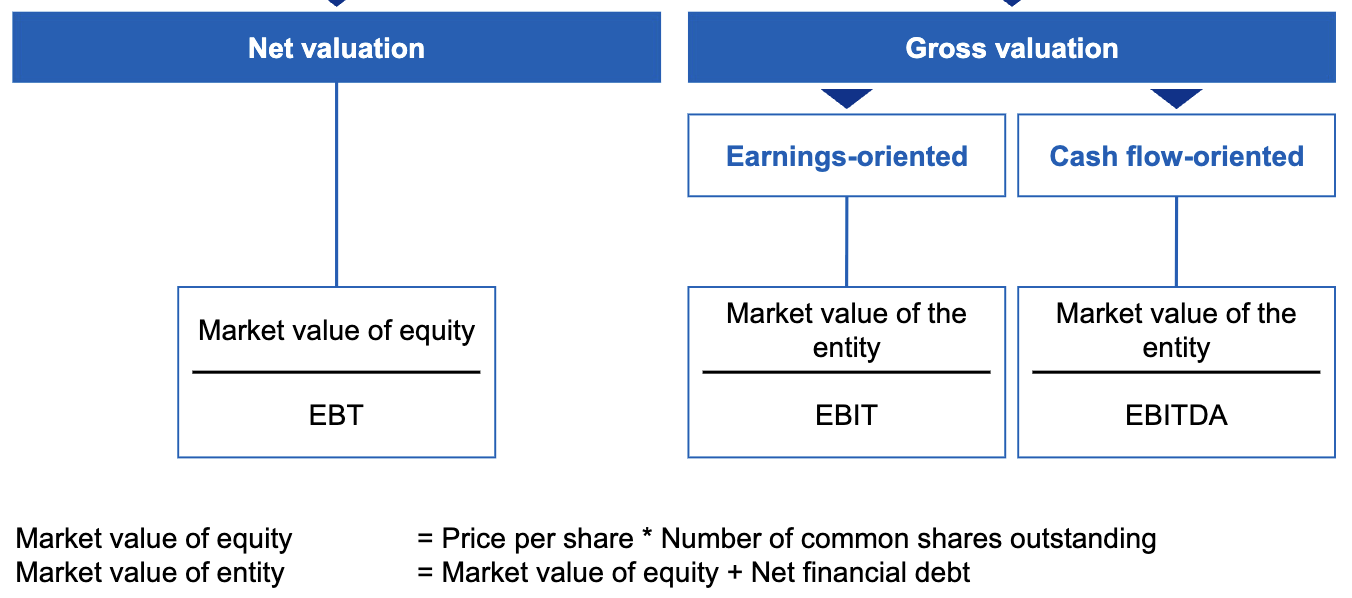
Market Value Multiples
Market-oriented (fair value) investor perspective, comparing market values to accounting values.
This is also often used for startup valuation whilst there’s no profit.
Example: In Munich, flats are often sold on a 30x multiplier: 30 times the annual cold rent.
Earnings per Share
| Measure | Definition | Interpretation |
|---|---|---|
| (Basic Earnings per Share) | Often used to describe company’s performance over time, basic of company valuation. Regulated in IFRS and US-GAAP. | |
| (Diluted Earnings per Share) | Considers the potential impact of corporate actions/stop option plans. |
Turnover Ratios
Turnover and Runtime Ratios
Turnover ratios compare a period of time to a point in time, indicating how often assets are “turned over” during a period.
Runtime ratios are their inverse: or
Turnover
| Measure | Definition | Interpretation |
|---|---|---|
| Inventory Turnover | Speed of inventory sale and and indicator for company performance. | |
| Receivables Turnover | Lower: Greater danger for liquidity problems if a customer is unable to make payment. Should also consider the number of debtors and can be optimized by active credit control. | |
| Payables Turnover | Shows payment practices. Reduction can indicate deteriorating payment ability and late payments. However, this can be positive if payment target use is increased and own liquidity is used more profitably. |
In practice, the average values between the beginning and end of the period is used to correspond to the point in time figure. In the lecture, the period-end value was used.
Runtime
| Measure | Definition | Interpretation |
|---|---|---|
| Day Inventory Outstanding | How many days a company needs to sell inventories it has bought in. | |
| Days Sales Outstanding | Avg. number of days until receivables are paid. Higher: Worse, as debtors are granted interest-free loans. Increase can also be caused by large sales being booked just before end of year or customers delaying payment until the next fiscal year. | |
| Days Payables Outstanding | Avg. number of days until trade liabilities are paid. Higher improves liquidity at first, but financing via trade payables is risky and can be expensive when not taking advantage of discounts. |
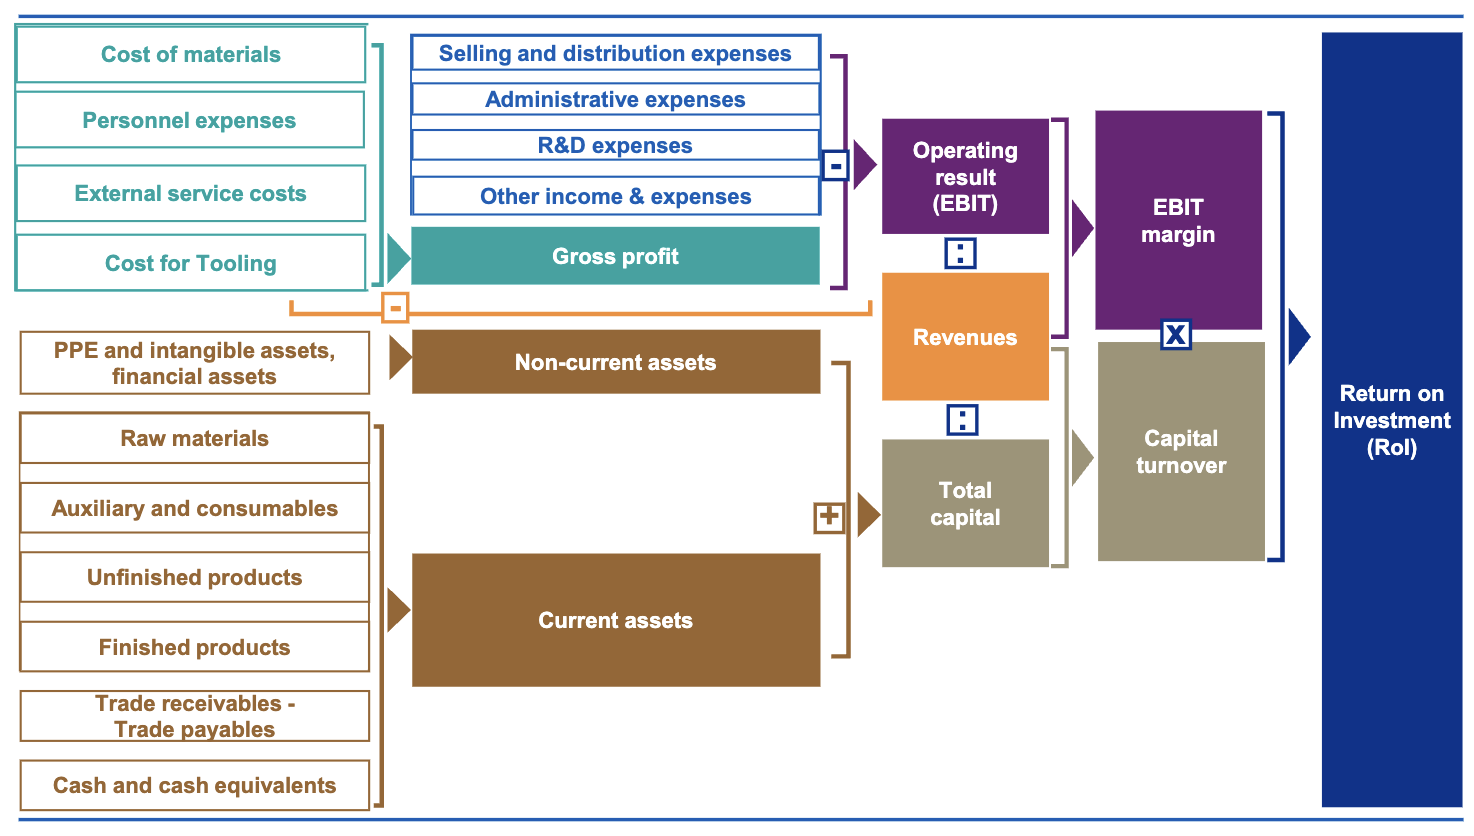
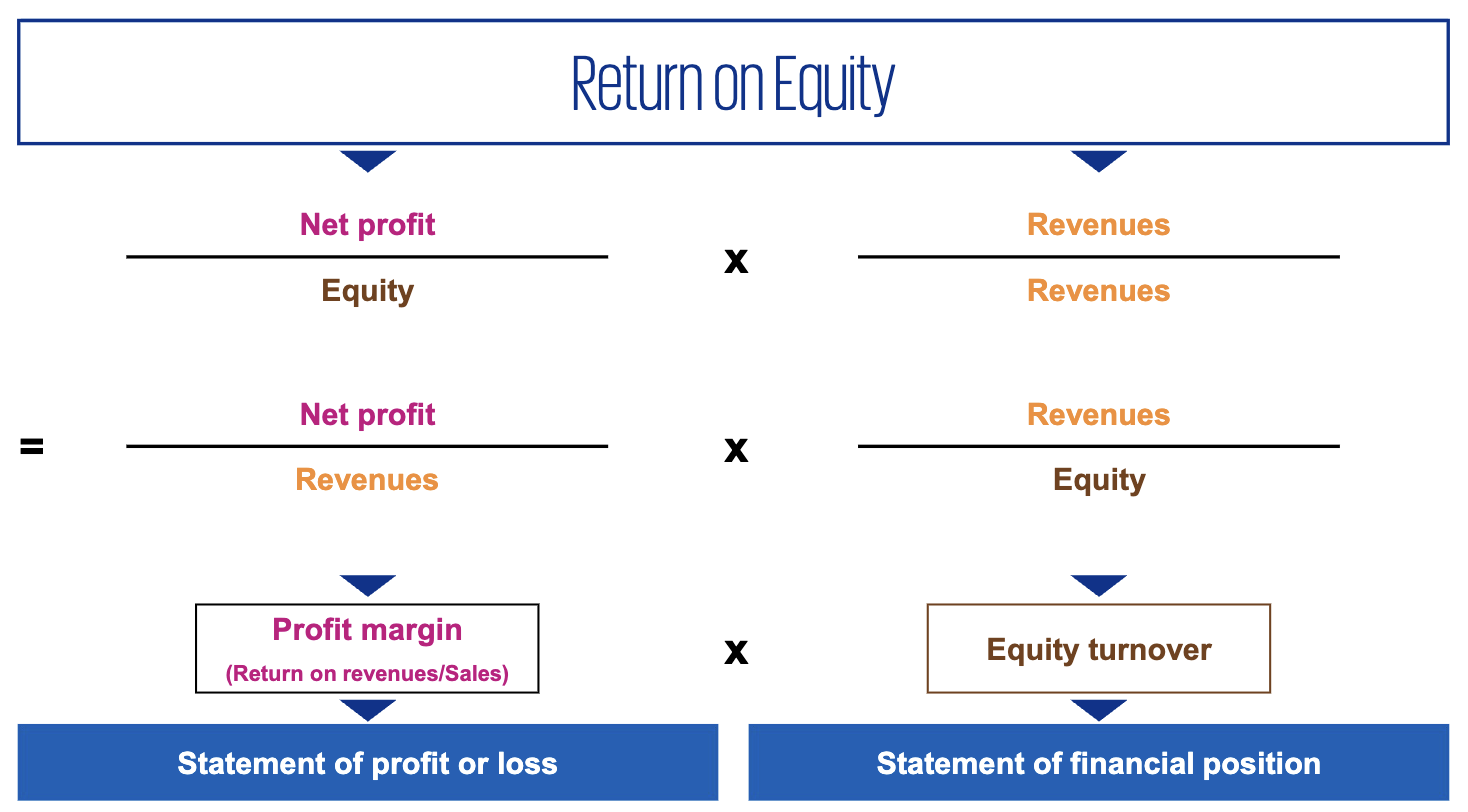
Key Figure Systems
Key figure systems like the DuPont analysis break down high-level return metrics into their operational drivers. This helps management identify specific areas for improvement. (p. 197)
Higher return on sales often leads to lower return on equity due to higher equity requirements and lower inventory turnover.
-
RoE Decomposition:
-
RoI Decomposition:

These breakdowns show that returns are driven by both profitability (margins) and efficiency (turnover). A company can improve its RoE/RoI by increasing its margins, using its assets more efficiently to generate sales, or a combination of both.
| Measure | Definition |
|---|---|
| Capital Turnover | |
| Equity Turnover |