Resources
- Slides
- Literature: Noorderhaven 1995, Horne, Wachovicz 2009
Context
Identifying if (financial) objectives are achieved is part of Strategy Making. Performance measurements are “the language of business” and essential to communicate strategy and objectives to stakeholders.
Measuring Performance
- Stock Figures are point-in-time figures
- Flow Figures are period figures
Differentiating Profit and Cash
Profit: Profitability
- Increase/decrease of equity: company makes profits or losses
- Profitability compared to past or others
- Flow in a period
- Profit = Income - Expenses; the bottom line of the income statement; EBIT is a common proxy
- Profit is taken by owners/shareholders
Cash: Liquidity
- Increase/decrease of cash holdings: if company is able to pay its bills
- Liquidity compared to current operations or investments
- Stock at a point in time
- Cash = Cash Inflows - Cash Outflows; bottom line of cash flow statement
- Cash is used to pay bills, salaries, investments
What profit and cash each "tell" (p. 9)
- Profit tells: profitability, period flow, comparison to past/others
- Cash tells: ability to pay bills, point‑in‑time stock, liquidity for operations and investments
Role of profit in management (p. 7)
- Peter F. Drucker: “Management must always, in every decision and action, put economic performance first.”
- Hasso Plattner (SAP): “For a public company, profit is everything, but in order to be profitable it must be a happy company, and I will do everything in my power to make us a happy company again.”
Profit and economic performance are central reference points in managerial decisions, but long‑term profitability depends on the health and motivation of the organization.
Bankruptcy Risk
Over‑Indebtedness
- Liabilities > Assets
- Equity < 0
- Negative total equity → balance sheet insolvency
- One possible reason for bankruptcy: ratio between liabilities and assets is unsustainable (p. 10)
Illiquidity
- Unable to pay bills when due (short‑term obligations cannot be met)
- Cash inflows < Cash outflows at relevant points in time
- Cash‑flow insolvency driven by the structure of assets:
- Too much tied up in fixed and current assets
- Too little available as cash or near‑cash
- Second, distinct reason for bankruptcy: even with positive equity, the firm can fail if it runs out of cash (p. 10)
Can occur when profit cannot be realized; e.g. when a customer does not pay their invoice.
Cash Imperative and Sources of Cash
Cash imperative (p. 11)
- Illiquidity is not an option; the firm must be liquid at every point in time
- Cash determines the space of managerial discretion
Main sources of cash (p. 11)
- Operating cash flow
- Asset structure (e.g., disinvestments)
- Cash in from external equity increase
- Cash in from external debt increase
Why Cash Is a Problem
Timing mismatch across the value chain creates financing needs (p. 12).
- Company acquires resources (cash outflows) → produces goods → delivers products
- Customers pay later (cash inflows), not necessarily when costs occur
- Result: cash gaps must be bridged to remain liquid over time
Financial Statements
Balance Sheet (Statement of Financial Position)
Stock figure / Snapshot of financial position at a point in time including assets and liabilities. It juxtaposes the sources of funds and their use (p. 13).
- Fixed assets: intangible, tangible, financial assets
- Current assets: inventories, accounts receivables, market securities, cash
- Equity: common stock, capital surplus, retained earnings, P/L carried forward, net income
- Liabilities: provisions, accrued liabilities, liabilities
Income Statement (Profit & Loss Statement)
Flow figure of revenues and expenses over a period of time. It provides information on the success of a company within a period (p. 20).
- Revenues: sales revenue, other operating income, interest income → Gross profit
- Expenses: R&D, sales cost, administrative cost, interest expenses → Operating income / EBIT
- Financial income/expenses → Income before taxes / EBT
- Income tax expenses → Net income / after tax (bottom line)
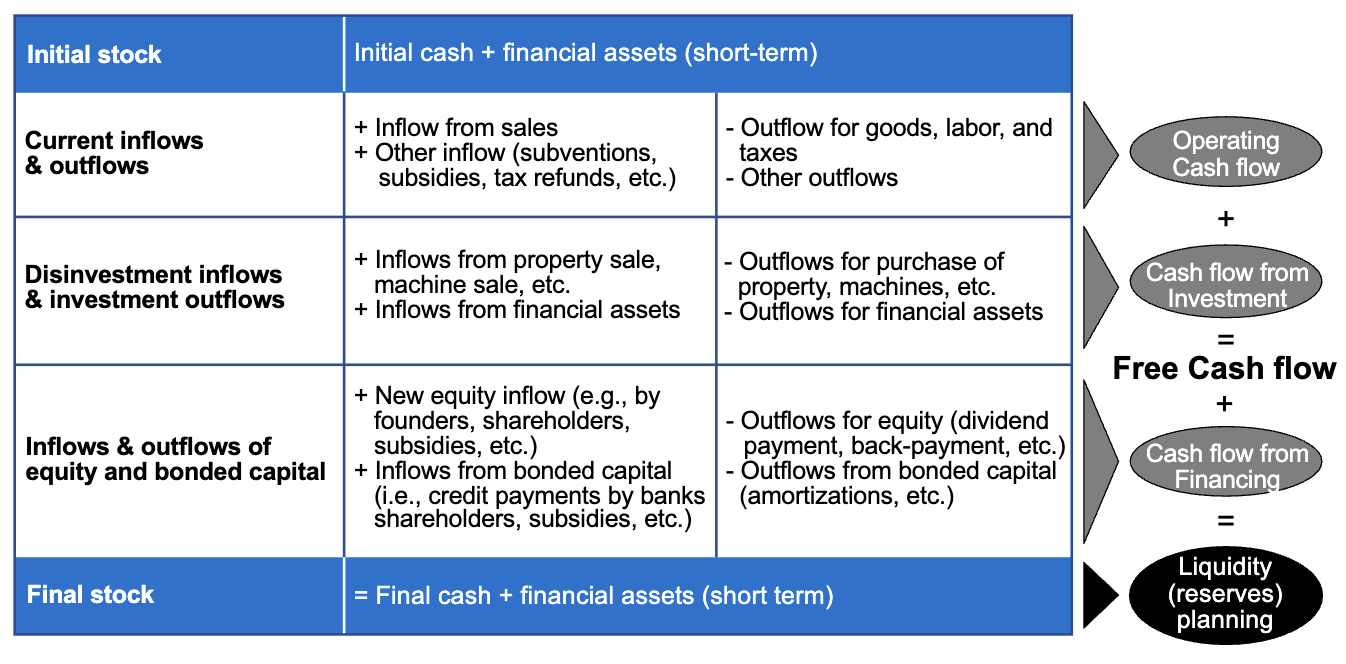
Cash Flow Statement
A flow figure of cash inflows and outflows over a period of time. It provides information on the liquidity of a company within a period (p. 21).
Accounting Vocabulary
Terms like Cash Outflow, Expenses, Costs, Expentitures are explained in Accounting
Spheres of Accounting
Financial instruments are built on three accounting spheres that correspond to each other. Managerial and Financial Accounting are explained in Accounting, however, Cash‑Flow Accounting is an additional sphere that focuses on cash flows for planning and controlling (p. 14).
| Managerial Accounting | Financial Accounting | Cash-Flow Accounting | |
|---|---|---|---|
| Recipient | Internal | External stakeholders | Internal & external |
| Function | Internal planning & controlling | Stakeholder reporting | Internal planning & controlling |
| Time | Past & future (Y, M, D) | Past (Y, M, D) | Past & Future (Y, M, D) |
| Regulation | Internally | e.g. IFRS / US-GAAP | Depending on legal form |
| Publication | Not usually | Obligatory | Depending on legal form |
| Performance Indicators | Benefits, costs, profits | Earnings, expenses, income; Assets/liabilities composition | Cash In-/Outflow; Cashflow |
| Instrument | Income statement based on benefits/costs | Income statement, balance sheet | Cash-flow statement |
Measuring Success
Success is relative to competitors and the market. Financial success is increasing the relative financial value (how much someone would pay to become a company’s owner) over time (p. 23).
Success can also mean achieving set objectives.
Financial value over time
- Success if Financial Value at > Financial Value at
- Focus on change across time () (p. 23)
Success/failure threshold (p. 24)
Owners/stakeholders define what constitutes success.
- How much increase constitutes success?
- Threshold concept:
- Minimal requirement:
- Stricter requirement: (to be defined by owners/criteria)
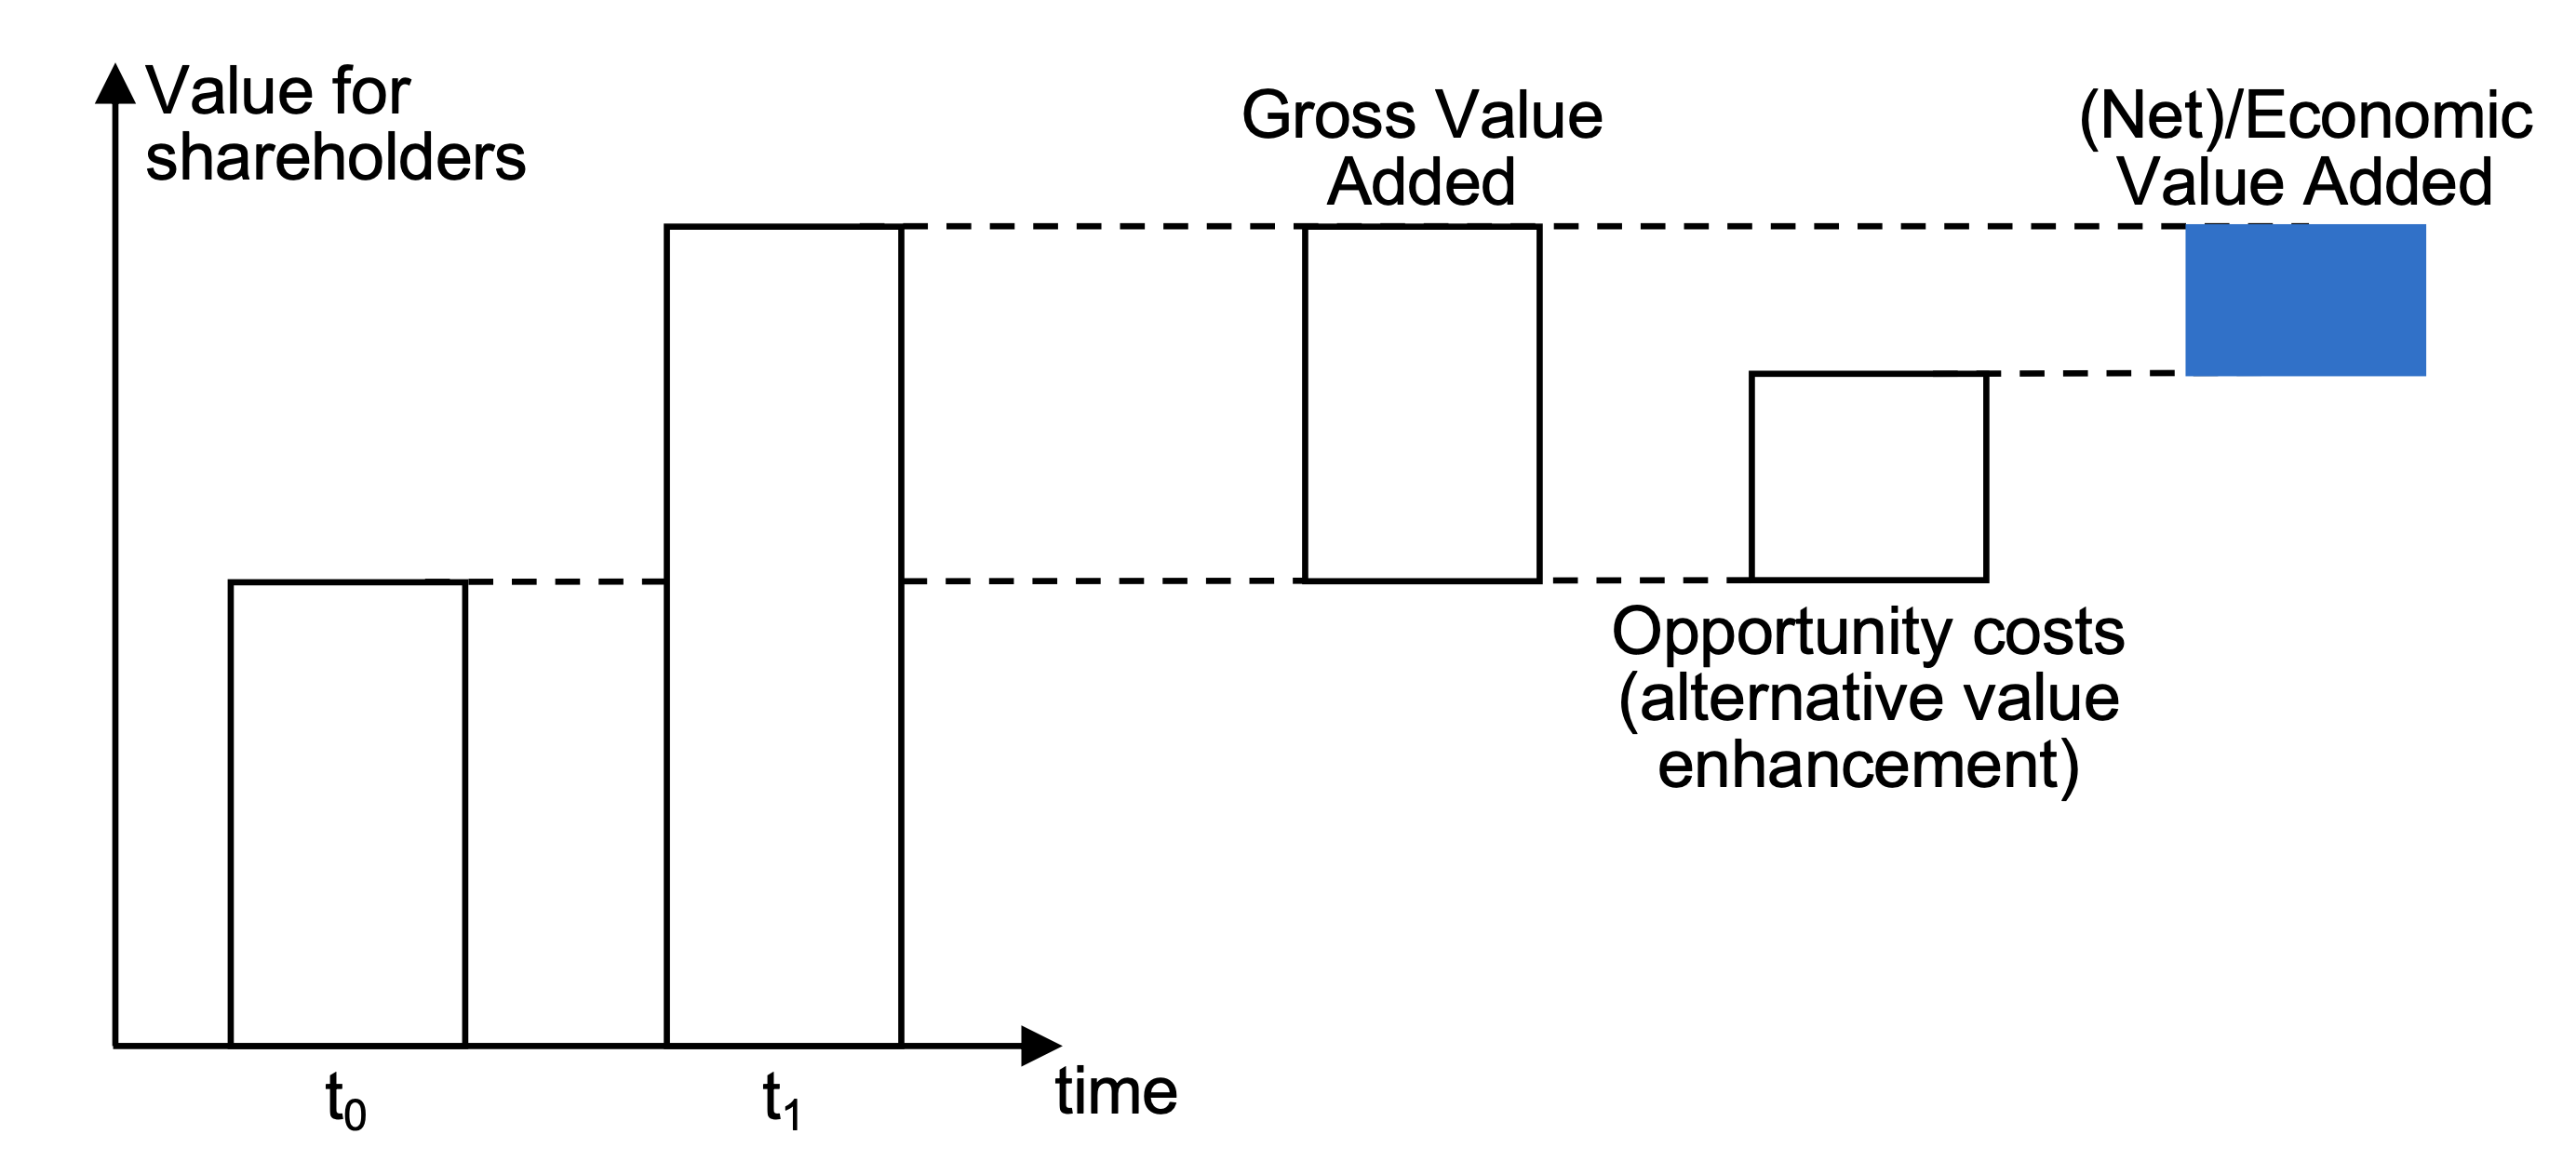
Strategy success and opportunity costs (p. 25)
- Strategy is evaluated over time by:
- Value for shareholders
- Gross value added / (Net) Economic Value Added
- Opportunity costs: value that could have been created by best alternative (e.g., market portfolio, other projects)
- A strategy is financially successful if value creation exceeds these opportunity costs
Economic Value Added (EVA)
To determine the net value added, opportunity costs are deducted from the gross value added. If the opportunity cost is negative (i.e. the competition / alternative options lost more value than the company), the company also creates value.
Economic value add is when the return on invested capital (ROI) exceeds the weighted average cost of capital (WACC) — when the capital income exceeds the opportunity costs of capital (p. 30).
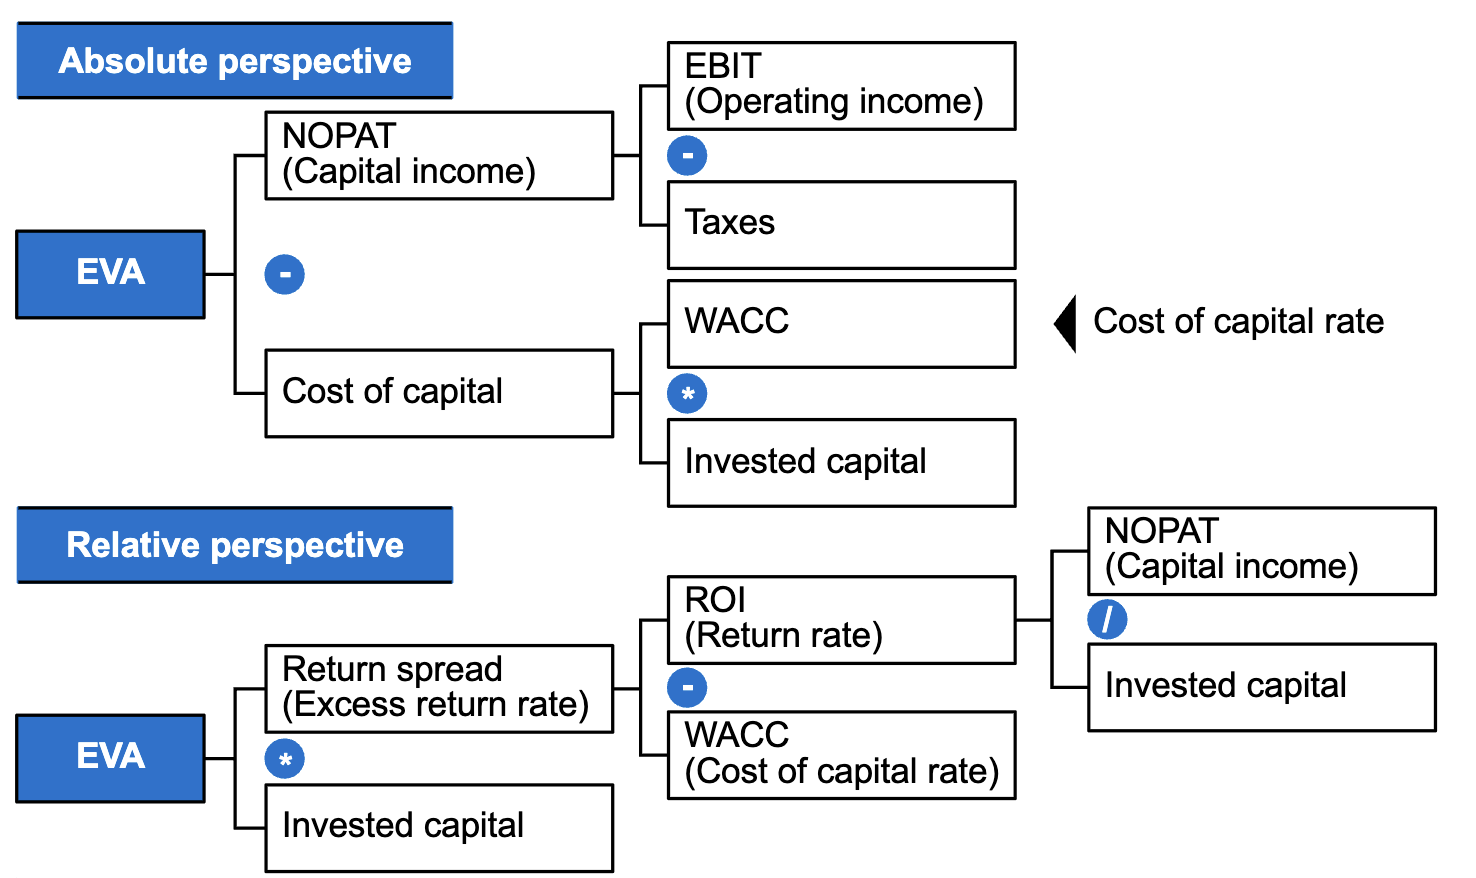
NOPAT: Net Operating Profit After Taxes
Evaluating Financial Value
Future Value & Present Value
Future Value is the value of a current asset at a future date based on an assumed rate of growth over time. Present Value is the present worth of a future sum of money or stream of cash flows given a specified rate of return.
Relevant because financial value is based on future cash flows/profits discounted to current value.
Formulas:
- Future Value (FV):
- Present Value (PV):
Cash-Based Approach
The cash-based approach focuses on cash flows as the primary driver of financial value. It is based on the following principles (p. 26):
- Free cash flow principle
- Discounting principle
- Cost of capital and opportunity cost principle
- Financial value as capitalization of future cash inflows
- Financial value as sum of discounted free cash flows
FV: Financial Value
FCF: Free Cash Flow
WACC: Weighted Average Cost of Capital
Profit-Based Approach
The profit-based approach focuses on profits as the primary driver of financial value. It is based on the following principles (p. 26):
- Capital productivity and efficiency principle
- Economic value add principle
- ROI and profit concepts
- Financial value as capitalization of future excess capital income
- Financial value as sum of discounted economic value adds in addition to invested capital
IC: Invested Capital
EVA: Economic Value Add
ROI: Return on Invested Capital
Liquidity
Free Cash Flow = Operating Cash Flow + Cash Flow from Investment
Liquidity = Free Cash Flow + Cash Flow from Financing (p. 21)
Discounting
Discounting makes payments from different periods comparable by converting future payments into present value (p. 28).
To transform a future financial value of a payment into today’s equivalent, the present value formula is applied:
To compare alternative investments, the opportunity cost of the alternative is considered via WACC (p. 29):
WACC: Weighted Average Cost of Capital
: Cost of Equity
: Cost of Debt
E: Equity
D: Debt
TC: Total Capital
Noorderhaven’s Models
Conceptual models of strategic decision making, based on Noorderhaven 1995, highlight how organizations approach complex choices. These models provide a theoretical foundation for understanding how strategy is formed and implemented, and are relevant to evaluating performance, success, and the organizational processes described in other sections.
Synoptical Planning Models
-
Design School: Strategy is a controlled, conscious, top-down process led by the CEO, who is the primary strategist. Other managers mainly gather information and implement the chosen strategy. Strategy formulation and implementation are separated, with little room for adaptation or learning. This approach emphasizes simplicity and informality, but risks detachment from operational reality and inhibits organizational learning.
-
Strategic Planning School: Similar top-down logic, but with formal, elaborate planning procedures and dedicated planning departments. Uses systems like OST (Objectives, Strategies, Tactics) to cascade objectives. Criticized for over-reliance on analysis and limited integration of creative, emergent strategies.
Connection: Both schools reflect a rational, formalized approach to decision making, which links to how objectives and performance measures are set in performance measurement and success evaluation.
Disjointed Incrementalism
-
Emphasizes limited rationality—managers cannot oversee all aspects or consequences. Strategy is rarely reconsidered comprehensively; instead, decisions focus on small, incremental changes. Fragmented decision making means different actors handle different issues, often coordinating only to avoid contradictions (negative coordination).
-
Prescriptive rules include focusing on realistic objectives, considering means and objectives together, and evaluating incremental alternatives.
Connection: This model highlights the practical constraints of decision making, paralleling the incremental adjustments seen in cash management and the adaptation of financial strategy over time.
Garbage Can Model
-
Developed for “organized anarchies” (e.g., universities) with ambiguous goals, unclear processes, and fluid participation. Decisions result from the coincidental meeting of problems, solutions, and participants. Many issues remain unresolved due to the lack of suitable combinations.
Connection: Illustrates the complexity and unpredictability of organizational processes, which can impact the reliability of financial statements and challenge traditional success metrics.
Logical Incrementalism
-
Combines intuition, evolution, and purposeful fragmentation. Managers experiment and adjust as information accumulates, with subsystems (cross-functional groups) working on different strategy parts. Top management coordinates overall direction, but strategies emerge from subsystem integration. Encourages organizational learning through short cycles and experimentation (“double-loop learning”).
Connection: Supports adaptive performance management, as described in measuring success and evaluating financial value, by enabling ongoing adjustment of both means and goals.
Interpretative Approach
-
Focuses on how shared mental models, organizational culture, and “paradigms” shape strategic choices. Managers act based on their interpretations, not objective reality; past successes reinforce particular viewpoints, potentially leading to rigidity (“success breeds simplicity”).
-
Organizational paradigms are reflected in power structures, routines, and culture, reinforcing groupthink and resistance to change.
Connection: Explains why organizations may persist with established strategies despite changing circumstances, affecting long-term success and the interpretation of financial data.
Exercises
Exercise 2
Question: Based on the accounting information below, what is the profit (net income) of the company? Assume that no other expenses occurred besides the ones shown below.
Cash: 240 m €
Personal costs: 170 m €
Interest expenses: 10 m €
Revenue: 1,580 m €
Depreciation: 160 m €
Material expenses: 320 m €
Liabilities: 220 m €
Other expenses: 50 m €
Taxes: 100 m €
a) 310 m €
b) 550 m €
c) 650 m €
d) 770 m €
e) 790 m €
f) 880 m €
Correct answer: d
Explanation: Net income equals revenue (1,580 m €) minus all expenses (170 + 10 + 160 + 320 + 50 + 100 = 810 m €), giving 1,580 − 810 = 770 m €.
- Cash, Liabilities are stock figures → irrelevant
- Start with revenue, deduct material, personnel, other operating expenses to get EBIT
- Deduct taxes to get Net Income
Exercise 1
Question: Insights AG receives an order request on 01.01.2025. The client pays the price for the order in two installments. The first payment will be paid on 01.01.2026 with 48 million Euro cash, the second payment will be paid on 01.01.2027 with 288 million Euro cash.
What is the value of the future cash flow from this order for Insights AG on 01.01.2025, assuming a constant annual interest rate of 20%?
a) 224 million Euro
b) 240 million Euro
c) 248 million Euro
d) 280 million Euro
e) 288 million Euro
f) 336 million Euro
Correct answer: b
Explanation: The present value on 01.01.2025 is 240 million Euro: